Exam 2: Presenting Data, and Central Tendency and Dispersion
Name the three measures of central tendency and indicate their purpose. Also, determine the level of measurement that is required for the individual measure.
Mode. The mode tells us which category or score occurs most frequently within a distribution. The mode can be determined with variables at the nominal, ordinal, interval, and ratio level.
Median. The median represents the midpoint of a distribution. It can be understood as the point that divides the distribution in two equal parts. The median can be determined with variables at the median, interval, and ratio level of measurement.
Mean. The mean represents the arithmetic average of a distribution. It can be calculated with continuous variables only.
The ACME community treatment center is attempting to evaluate the types and amounts of resources and interventions they should provide to their clients. It is known that elderly clients (50+) typically require fewer resources, followed by the middle-aged clients. Finally, younger clients (<30) are more likely to recidivate, which indicates a greater need for more services.
The following are a list of ages from a sample of individuals incarcerated in one treatment cohort in the
ACME CTC in 2015 25 31 30 26 27 63 32 28 34 32 19 32 59 33 23 55 30 33 28 29 22 52 57 47 21 29 25 18 29 48 19 23 33 75 18
a. Create a grouped frequency distribution of the dataset. Group ages as you feel best suits the dataset. Be sure to include the frequency and the percentage for each grouping.
b. Based on your created frequency distribution, which group should the ACME CTC invest in? Why? Should any other groups be included? Why or why not?
a. Group 1: youngest (<30), freq. = 17 (49%); group 2: middle aged (30-49), freq. = 12 (34%); group 3: elderly (≥50), freq. = 6 (17%).
b. XACME CTC should invest in the youngest group, because they are the most represented in their population and most prone to recidivism. We could break the under 30 category further so that teenagers are disaggregated, since they often need unique services.
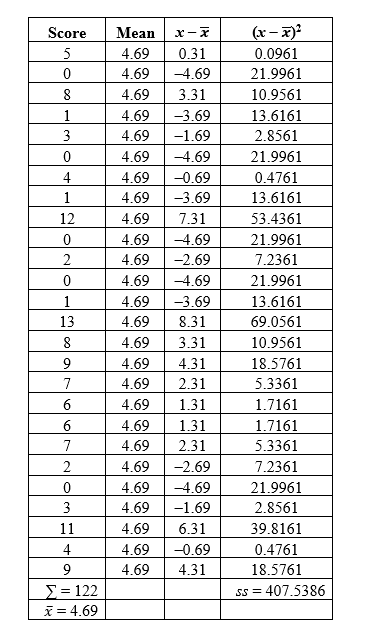
The following is a distribution representing the number of prior convictions of 26 inmates of a local county jail. Compute the range, variance, and standard deviation.
5 0 0 1 8 13 1 8 3 9 0 7 4 6 1 6 12 7 0 2 2 0 3 4 11 9
Standard deviation
The average number of prior convictions an individual had was 4.69 . The standard deviation was 4.4, meaning that the majority of inmates had between 0.65 and 8.73 prior convictions.
In what circumstances would you chose the median over the mean? (Assume the calculation of either is possible.)
Calculate the mode, median, and mean for the following distribution of scores. Also indicate whether the distribution is positively or negatively skewed.
21 23 23 15 15 7 2 6 3 23 9 15 21 6 19 8 23 15 8 17
The following represents the results of a survey conducted with 25 high school students indicating the number of times (f) the individual student has skipped class within the past academic year. Which measures of central tendency can you compute? Compute/determine all that are possible. Also indicate whether the distribution is positively or negatively skewed.
No. skipped 0 3 1 8 2 1 3 0 4 3 5 0 6 4 7 2 8 0 9 0 10 2 11 1 12 1
Calculate the mode, median, and mean for the following distribution of scores. Also indicate whether the distribution is positively or negatively skewed.
5 6 2 6 3 3 4 1 9 3 2 10 1 9 3 2 8 6 7 5 8 8 6 7 9 6 5 6 9 5
Indicate the three main measures of dispersion (which were discussed in this chapter) and briefly describe their purpose.
The following table represents the number of individuals within a federal prison categorized by race. Which measures of central tendency can you compute? Compute/determine all that are possible.
Race/ethnicity f Caucasian 215 African American 455 Native American 120 Hispanic/Latino 222 Asian 95 Other 26
You are gathering information about different Master's programs in criminal justice. One thing you want to know is how many students of a cohort drop out each year. The program director of the first school informs you that 45 students dropped out in the previous academic year. The second program you are interested in reports a number of 8 drop-outs in the last academic year.
a. Now consider 879 graduate students are enrolled in program 1, whereas 135 are enrolled in program 2. Does your interpretation change? Report the drop-out rate per 50 students.
b. Calculate the percentage of drop-outs for both programs.
Let's take the distribution provided in problem 6. Compute the range, variance, and standard deviation.
5 6 2 6 3 3 4 1 9 3 2 10 1 9 3 2 8 6 7 5 8 8 6 7 9 6 5 6 9 5
Let's go back to the distribution we utilized in problem 4 (how often students skipped class in the past 12 months). Compute the range, variance, and standard deviation No. skipped 0 3 1 8 2 1 3 0 4 3 5 0 6 4 7 2 8 0 9 0 10 2 11 1 12 1 .
The following table displays how often graduate students at your school (random sample of 50) have used marijuana in their life. Which measures of central tendency can you compute? Compute/determine all that are possible.
Code Use No. 0 Never 7 1 1-5 17 2 6-10 4 3 11-15 6 4 16-20 8 5 21-25 5 6 26+ 3 Total 50
Consider the following dataset, which captures relapse/no-relapse of 20 individuals after treatment within a correctional facility. The data are coded in a way that 0 indicates no relapse and 1 indicates relapse.
a. Indicate how many individuals fall in category 0 and how many in category 1 (counts).
b. Compute the percentages of individuals who did not relapse after treatment in a corrections facility and that of individuals who did relapse.
ID Relapse/ No. no relapse 1 0 2 0 3 1 4 1 5 1 6 0 7 1 8 1 9 0 10 0 11 0 12 1 13 1 14 1 15 1 16 1 17 0 18 1 19 1 20 0
What is the reason for the denominator in the formula of (sample) variance and (sample) standard deviation to be n - 1 and not simply n?
Filters
- Essay(0)
- Multiple Choice(0)
- Short Answer(0)
- True False(0)
- Matching(0)