Exam 1: Introduction to Statistics
Exam 1: Introduction to Statistics80 Questions
Exam 2: Summarizing Data: Frequency Distributions in Tables and Graphs80 Questions
Exam 3: Summarizing Data: Central Tendency80 Questions
Exam 4: Summarizing Data: Variability80 Questions
Exam 5: Probability80 Questions
Exam 6: Probability, normal Distributions, and Z Scores80 Questions
Exam 7: Probability and Sampling Distributions80 Questions
Exam 8: Hypothesis Testing: Significance,effect Size,and Power80 Questions
Exam 9: Testing Means: One-Sample and Two-Independent-Sample T Tests80 Questions
Exam 10: Testing Means: Truehe Related-Samples T Test80 Questions
Exam 11: Estimation and Confidence Intervals60 Questions
Exam 12: Analysis of Variance: One-Way Between-Subjects Design80 Questions
Exam 13: Analysis of Variance: One-Way Within-Subjects Repeated-Measuresdesign80 Questions
Exam 14: Analysis of Variance: Two-Way Between-Subjects Factorial Design80 Questions
Exam 15: Correlation80 Questions
Exam 16: Linear Regression and Multiple Regression80 Questions
Exam 17: Nonparametric Tests: Chi-Square Tests80 Questions
Exam 18: Nonparametric Tests: Tests for Ordinal Data60 Questions
Select questions type
Which of the following terms is least likely to be used to describe qualitative data?
(Multiple Choice)
4.9/5  (30)
(30)
The duration of attention (in seconds)is a ratio scale measurement.
(True/False)
4.9/5 (35)
Most scientists have limited access to the behavioral phenomena they study.
(True/False)
4.9/5 (33)
The use of tables and graphs to summarize data is an example of
(Multiple Choice)
4.9/5 (32)
______ is the variable in an experiment that is manipulated between conditions being observed.
(Multiple Choice)
4.9/5 (35)
Which of the following best describes a dependent variable?
(Multiple Choice)
4.8/5 (29)
Recording whom students study with describes ______ types of data,whereas recording the number of hours spent studying per week describes ______ types of data.
(Multiple Choice)
4.7/5 (33)
Qualitative data vary by ______; quantitative data vary by ______.
(Multiple Choice)
4.9/5 (36)
Inferential statistics is used to determine if observations made in a sample are likely to also be observed in the population from which the sample was selected.
(True/False)
4.9/5 (32)
Researchers measure data in a ______ to learn more about individuals in the larger ______ of interest.
(Multiple Choice)
4.8/5 (37)
A professor measures the number of review sessions attended per week and GPA in a sample of college freshmen and concludes that increased attendance for review sessions is related to higher grades.This research design is an example of an experimental design.
(True/False)
5.0/5 (44)
Descriptive statistics is a branch of mathematics used to make inferences about populations given samples of data.
(True/False)
4.8/5 (42)
Which of the following research designs is used to determine the causes of behavior that help to explain why the behavior occurs?
(Multiple Choice)
4.8/5 (41)
Based on the following graphical summary display,what research design was used to record and analyze these data?
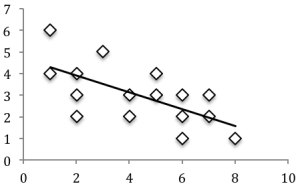
(Multiple Choice)
4.8/5 (38)
The number of students in a class is an example of discrete,quantitative data.
(True/False)
4.9/5 (32)
In some cases,the number of participants in a sample can be greater than the number of persons in the population from which the same was selected.
(True/False)
5.0/5 (31)
A social psychologist interested in the expression of love toward a significant other among American family members selects a few American family members for a study.In this example,the few American family members is the sample.
(True/False)
4.8/5 (37)
Which of the following best describes an independent variable?
(Multiple Choice)
5.0/5 (45)
Only an experiment can demonstrate cause-and-effect relationships between variables.
(True/False)
4.9/5 (31)
Filters
- Essay(0)
- Multiple Choice(0)
- Short Answer(0)
- True False(0)
- Matching(0)