Exam 15: Correlation
Exam 1: Introduction to Statistics80 Questions
Exam 2: Summarizing Data: Frequency Distributions in Tables and Graphs80 Questions
Exam 3: Summarizing Data: Central Tendency80 Questions
Exam 4: Summarizing Data: Variability80 Questions
Exam 5: Probability80 Questions
Exam 6: Probability, normal Distributions, and Z Scores80 Questions
Exam 7: Probability and Sampling Distributions80 Questions
Exam 8: Hypothesis Testing: Significance,effect Size,and Power80 Questions
Exam 9: Testing Means: One-Sample and Two-Independent-Sample T Tests80 Questions
Exam 10: Testing Means: Truehe Related-Samples T Test80 Questions
Exam 11: Estimation and Confidence Intervals60 Questions
Exam 12: Analysis of Variance: One-Way Between-Subjects Design80 Questions
Exam 13: Analysis of Variance: One-Way Within-Subjects Repeated-Measuresdesign80 Questions
Exam 14: Analysis of Variance: Two-Way Between-Subjects Factorial Design80 Questions
Exam 15: Correlation80 Questions
Exam 16: Linear Regression and Multiple Regression80 Questions
Exam 17: Nonparametric Tests: Chi-Square Tests80 Questions
Exam 18: Nonparametric Tests: Tests for Ordinal Data60 Questions
Select questions type
The formula for the point-biserial correlation coefficient was derived from the formula for the Pearson correlation coefficient.
(True/False)
4.7/5  (33)
(33)
The Spearman rank-order correlation coefficient is a measure of the direction and strength of the linear relationship between two ______ variables.
(Multiple Choice)
4.8/5 (38)
A researcher determines that 2 = 3.56 to test for significance for a phi correlation coefficient.What was the decision for this phi correlation test?
(Multiple Choice)
4.8/5 (46)
The coefficient of determination is mathematically equivalent to 2.
(True/False)
4.9/5 (45)
Linearity is the assumption that the best way to describe a pattern of data is using a straight line.
(True/False)
4.8/5 (34)
A researcher observes a correlation of values from 2 to 10 points and draws conclusions about the full range of values in the population from 0 to 21 points.Which limitation for correctly interpreting a correlation coefficient did the researcher violate?
(Multiple Choice)
4.9/5 (39)
Which of the following is a limitation for interpreting a correlation?
(Multiple Choice)
4.9/5 (40)
The phi correlation coefficient is used to measure the correlation between two ordinal variables.
(True/False)
4.9/5 (33)
A researcher measures the correlation in rankings for a sample of restaurants and consumers' rankings of their favorite restaurants.If = 96 and n = 12,then what is the value of the correlation coefficient?
(Multiple Choice)
4.8/5 (28)
Select the description below that identifies the following correlation: r = .28,p < .01.
(Multiple Choice)
4.7/5 (45)
Which of the following indicates the strongest correlation?
(Multiple Choice)
4.9/5 (38)
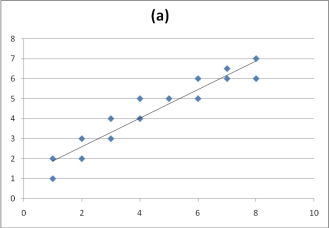
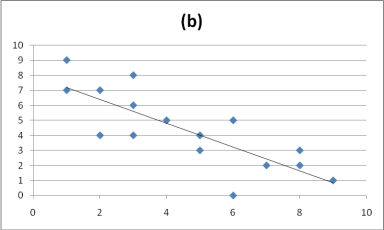
The following graphs display the data points for two linear correlations.Based on the information provided in these graphs,______ displays a negative correlation and ______ displays a stronger correlation.
(Multiple Choice)
4.9/5 (33)
To summarize correlations,we report the strength,the direction,and the p value for each correlation coefficient.
(True/False)
4.9/5 (32)
A researcher measures the correlation between the frequency of self-esteem (high,low)and health status (lean/healthy,overweight/obese).Based on the frequencies for each nominal category given below,what is the value of the phi correlation coefficient?

(Multiple Choice)
4.9/5 (37)
The phi correlation coefficient is a measure for the direction and strength of the linear relationship between two ______ variables.
(Multiple Choice)
4.8/5 (40)
The denominator of the correlation coefficient measures the extent to which two variables ______.
(Multiple Choice)
4.8/5 (47)
Filters
- Essay(0)
- Multiple Choice(0)
- Short Answer(0)
- True False(0)
- Matching(0)