Exam 7: Perfect Competition and the Invisible Hand
Exam 1: The Principles and Practice of Economics103 Questions
Exam 2: Economic Methods and Economic Questions94 Questions
Exam 3: Optimization: Doing the Best You Can94 Questions
Exam 4: Demand, supply, and Equilibrium185 Questions
Exam 5: Consumers and Incentives187 Questions
Exam 6: Sellers and Incentives261 Questions
Exam 7: Perfect Competition and the Invisible Hand251 Questions
Exam 8: Trade264 Questions
Exam 9: Externalities and Public Goods223 Questions
Exam 10: The Government in the Economy: Taxation and Regulation244 Questions
Exam 11: Markets for Factors of Production237 Questions
Exam 12: Monopoly295 Questions
Exam 13: Game Theory and Strategic Play199 Questions
Exam 14: Oligopoly and Monopolistic Competition264 Questions
Exam 15: Trade-Offs Involving Time and Risk147 Questions
Exam 16: The Economics of Information119 Questions
Exam 17: Auctions and Bargaining123 Questions
Exam 18: Social Economics111 Questions
Select questions type
The invisible hand is mostly guided by ________.
Free
(Multiple Choice)
4.8/5  (37)
(37)
Correct Answer: Verified
C
Which of the following statements is true?
Free
(Multiple Choice)
4.9/5 (45)
Correct Answer:Verified
C
Scenario: There are two firms producing ballpoint pens in a perfectly competitive industry. The market price of one pen is $5. Firm A has a lower marginal cost than Firm B. The following graphs illustrate the marginal cost curves of both firms.
 -Refer to the scenario above.The average total cost of Firm A when it produces 100 pens is $3,and the average total cost of Firm B when it produces 50 pens is $7.At these levels of production,which of the following statements is true?
Free
(Multiple Choice)
4.9/5 (34)
Correct Answer:Verified
C
Scenario: The figure on the left shows the demand for fuel by Lisa and Nick during ordinary times. Assume that Lisa and Nick are the only consumers. In the figure on the right, D₀ is the market demand, and S₀ is the supply in ordinary times in the town. Then a hurricane hits the town. The acute needs for fuel to operate electric generators pushes the demand to D₁. Meanwhile, the supply plummets to S₁ because some of the fuel storage tanks owned by the town seller have been damaged by the storm. This pushes the price up to $5 per liter and only Lisa can afford some fuel. Suppose that fuel sellers outside the affected area have a cost of production such that MC = ATC at $2.50 per liter, which includes the cost of transporting the fuel under hazardous conditions.
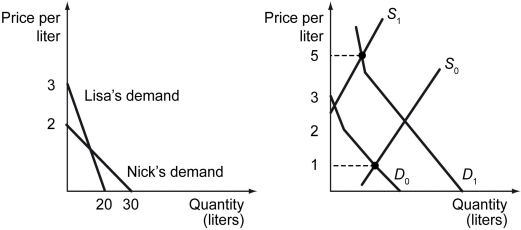 -Refer to the scenario above.What will likely happen if no law against price gouging is enacted?
(Multiple Choice)
4.8/5 (39)
The following graph represents the market for a certain good.
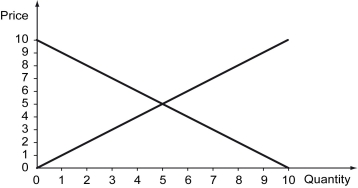 -Refer to the graph above.Which two outcomes create the same social surplus?
(Multiple Choice)
4.9/5 (43)
The following figure shows the demand and supply curves for bottled water.
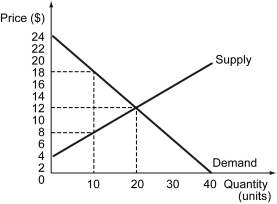 -Refer to the figure above.What is the equilibrium price of bottled water?
(Multiple Choice)
4.8/5 (31)
Scenario: The table below lists the willingness to pay for ten potential buyers of a Walter Payton rookie card and the willingness to accept for ten potential sellers of the card. (Walter Payton was a running back for the NFL's Chicago Bears from 1985 to 1987 and was elected into the NFL's Hall of Fame in 1993.) The graph below the table can be used to display the demand and supply schedules.
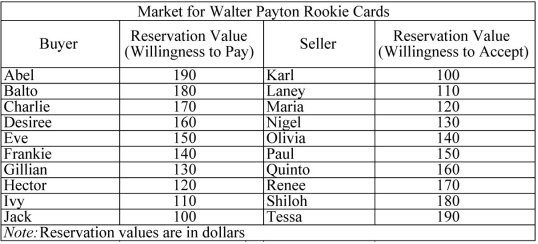
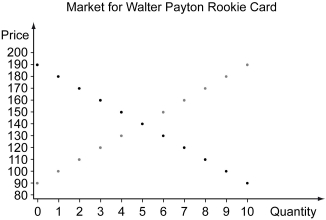 -Refer to the scenario above.In the graph above,plot the market demand schedule from the willingness to pay of buyers,and graph the market supply schedule from the willingness to accept of sellers.(Hint: Use the stairstep method similar to Exhibits 7.2 and 7.3 in the textbook; over and down for drawing market demand,and up and over for drawing market supply.)
(Essay)
4.8/5 (33)
Scenario: The rare earth element neodymium is one of the essential ingredients in the magnets used in computer hard drives and loudspeakers, among many other devices. The figures below shows a hypothetical pictures of supply and demand for neodymium, loudspeakers, and computer hard drives. The latter two are accompanied by the pictures of cost curves for a typical firm in those markets. Initially, all markets are in the long-run equilibrium at the prices shown. Then a surge in demand for loudspeakers takes place due to a rapidly increasing popularity of hi-fidelity audio equipment in China. This will cause a change in the loudspeaker market (Step 1), which in turn causes a change in the neodymium market (Step 2), which will cause a change in the hard drive market and the loudspeaker market (Step 3), and so on.
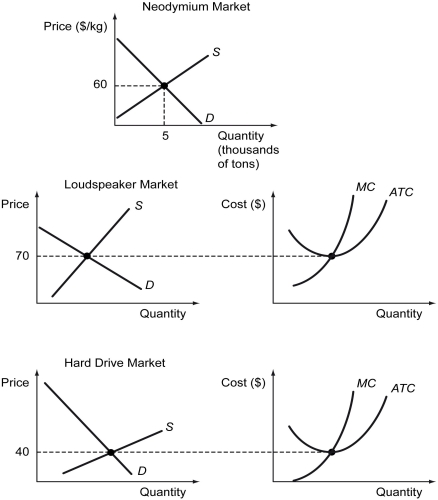 -Refer to the scenario above.Taking into account the initial reaction in the loudspeaker market in Step 1,what is expected to happen in the neodymium market (in Step 2)?
(Multiple Choice)
4.9/5 (32)
After the imposition of the price controls, consumer surplus is represented in the graph below.
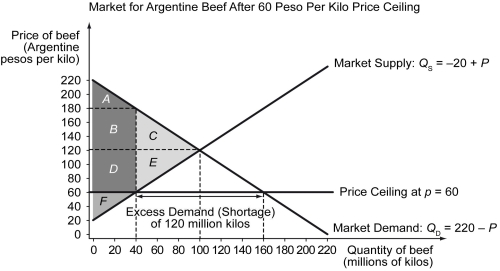 -In the graph above,producer surplus for Argentine beef retailers after the imposition of the price control is given by which areas?
(Multiple Choice)
4.8/5 (26)
Differentiate between the coordination problem and the incentive problem.
(Essay)
4.8/5 (29)
________ relates to the distribution of resources across society.
(Multiple Choice)
4.9/5 (40)
The following figure illustrates the marginal cost (MC)curves of two firms operating in the same industry.The marginal cost of Firm B is higher than the marginal cost of Firm A.
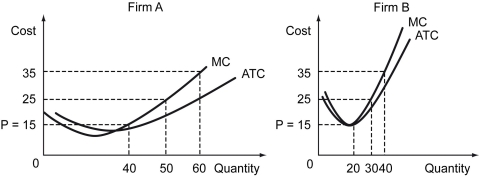 a)What is the optimal output of each firm if the market price is $15?
b)The government decides to shut down Firm B,as it has a higher marginal cost than Firm A.If it does so and asks Firm A to produce the combined output of firms A and B,will production be efficient? Explain your answer.
c)How does the invisible hand work in such an industry?
a)What is the optimal output of each firm if the market price is $15?
b)The government decides to shut down Firm B,as it has a higher marginal cost than Firm A.If it does so and asks Firm A to produce the combined output of firms A and B,will production be efficient? Explain your answer.
c)How does the invisible hand work in such an industry?
(Essay)
4.7/5 (41)
If a buyer enjoys a consumer surplus of $25 when he purchases a good for $50,his willingness to pay for the good is ________.
(Multiple Choice)
4.7/5 (24)
The basic idea behind an auction is that buyers want to buy from sellers with the ________,and sellers want to sell to buyers with the ________.
(Multiple Choice)
4.8/5 (37)
Scenario: A manufacturing firm operates three plants with the marginal cost curves shown in the figure and the average total costs summarized in the table below.
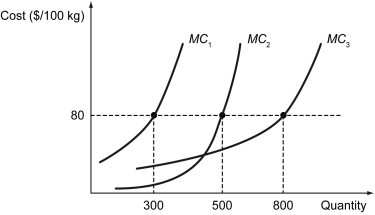
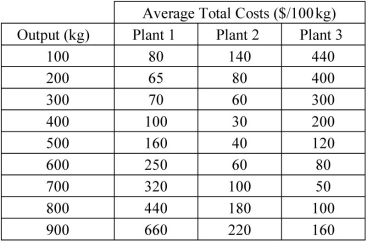 -Refer to the scenario above.The firm should exit the market if the price per 100 kg falls below ________.
(Multiple Choice)
4.9/5 (29)
When sellers in a perfectly competitive market attempt to maximize their own profits,they ________.
(Multiple Choice)
4.9/5 (40)
Scenario: Suppose a competitive market has ten buyers and ten sellers. The product exchanged in this market is beach hats, which are indivisible. The following table shows the reservation values for both buyers and sellers.
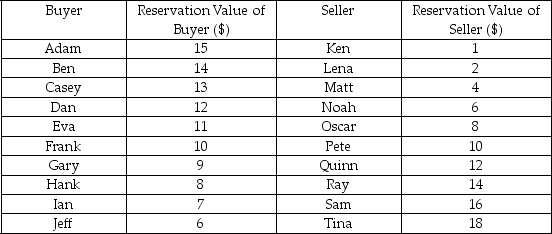 -Refer to the scenario above.If the market is perfectly competitive,the equilibrium quantity of hats is ________.
(Multiple Choice)
4.8/5 (33)
The following figure illustrates the demand and supply of decorative light bulbs in a perfectly competitive market.
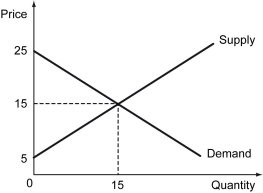 -Refer to the figure above.What is the social surplus if the market is in equilibrium?
(Multiple Choice)
4.8/5 (34)
Filters
- Essay(0)
- Multiple Choice(0)
- Short Answer(0)
- True False(0)
- Matching(0)