Exam 5: Inner Product Spaces
Exam 1: Linear Equations25 Questions
Exam 2: Matrices48 Questions
Exam 3: Determinants47 Questions
Exam 4: Vector Spaces100 Questions
Exam 5: Inner Product Spaces54 Questions
Exam 6: Linear Transformations46 Questions
Exam 7: Eigenvalues Eigenvectors32 Questions
Select questions type
Sketch the graph of the cross product  of the unit vectors
  ,
,  .
.
(Multiple Choice)
4.8/5  (31)
(31)
Verify the points  are the vertices of a parallelogram, then find its area.
(Essay)
4.8/5 (43)
Suppose that the following table shows the annual sales, in millions of dollars, for Advanced Auto Parts and Auto Zone for 2000 through 2007. Find the least squares quadratic model for Advanced Auto Parts. Let t represents the year, with  corresponding to 2000. Round all coefficients to two decimal places.
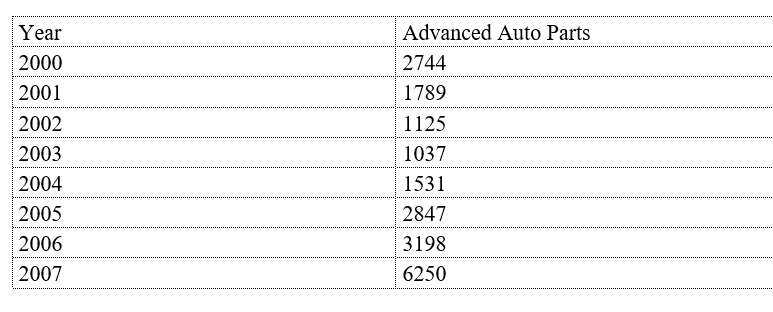
(Multiple Choice)
4.9/5 (46)
Find the area of the parallelogram that has the vectors  ,
,  as adjacent sides.
(Multiple Choice)
4.7/5 (38)
Find the linear least squares approximating function g for the function  ,
,  .
.
(Multiple Choice)
4.8/5 (35)
Find the Fourier approximation of second order for the function  on the interval
  .
.
(Multiple Choice)
4.8/5 (33)
Determine whether the set of vectors  in R3 is orthogonal (but not orthonormal), orthonormal, or neither.
(Multiple Choice)
4.9/5 (42)
Suppose that the table shows the world carbon dioxide emissions y in millions of metric tons during the years 1999 to 2004. Find the least squares regression line for the data. Let t represent the year, with  corresponding to 1999. Round your answer to four significant figures
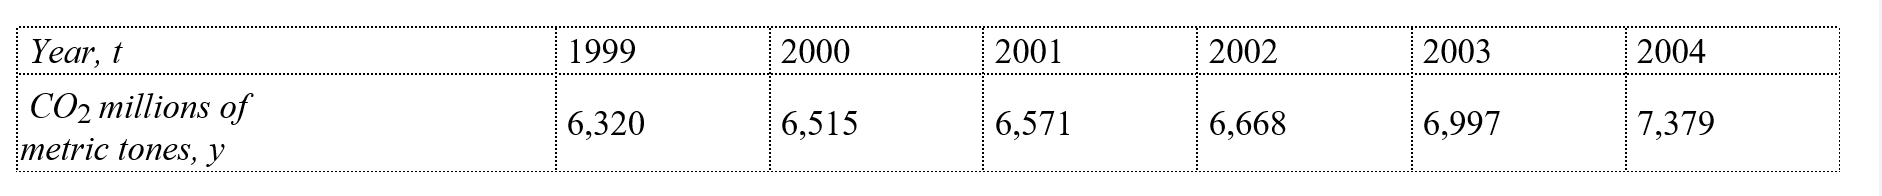
(Multiple Choice)
4.7/5 (39)
Suppose that the following table shows the annual sales, in millions of dollars, for Advanced Auto Parts and Auto Zone for 2000 through 2007. Find the least squares quadratic model for Advanced Auto Parts and use the model to predict sales for the year 10. Let t represent the year, with  corresponding to 2000. Round all coefficients to two decimal places and the answer to nearest million dollars.
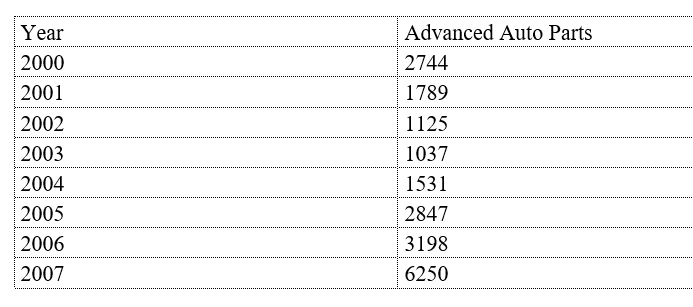
(Multiple Choice)
4.7/5 (31)
Use the Gram-Schmidt orthonormalization process to transform the basis  for R3 into an orthonormal basis. Use the Euclidean inner product for R3 and use the vectors in the order in which they are shown.
(Multiple Choice)
4.7/5 (38)
Show that the cross product 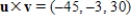 of the vectors
  ,
,  is orthogonal to both u and v.
(Essay)
4.8/5 (34)
Graph the points  and the least squares regression line for the data points on the same set of axes.
(Multiple Choice)
4.9/5 (37)
Filters
- Essay(0)
- Multiple Choice(0)
- Short Answer(0)
- True False(0)
- Matching(0)