Exam 2: Rates of Change and Linear Functions
Exam 1: An Introduction to Data and Functions149 Questions
Exam 2: Rates of Change and Linear Functions215 Questions
Exam 3: When Lines Meet: Linear Systems81 Questions
Exam 4: The Laws of Exponents and Logarithms: Measuring the Universe201 Questions
Exam 5: Growth and Decay: An Introduction to Exponential Functions146 Questions
Exam 6: Logarithmic Links: Logarithmic and Exponential Functions108 Questions
Exam 7: Power Functions109 Questions
Exam 8: Quadratics and the Mathematics of Motion127 Questions
Exam 9: New Functions From Old137 Questions
Select questions type
The function,  , gives the speed (in miles per hour), s, of a car at time t minutes.
Evaluate s(2).
, gives the speed (in miles per hour), s, of a car at time t minutes.
Evaluate s(2).
(Short Answer)
4.8/5  (38)
(38)
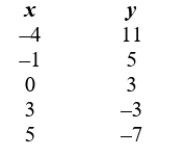
Determine whether the following data is linear. If it is linear, find the function and write your answer in  form. If the data is not linear, enter Not Linear.
(Essay)
4.8/5 (41)
The function,  , gives the speed (in miles per hour), s, of a car at time t minutes.
Find the speed (in miles per hour) of the car at time 3 minutes.
, gives the speed (in miles per hour), s, of a car at time t minutes.
Find the speed (in miles per hour) of the car at time 3 minutes.
(Short Answer)
4.8/5 (34)
A worker in a fast food restaurant earns a daily gross pay of $72.00 for 8 hours of work.
A) What is the pay rate, in dollars per hour? Round your answer to 2 decimal places.
B) How much will the worker earn for 33 hours of work?
C) How many hours will it take the worker to earn $5,500 in gross pay?
Round your answer to the nearest hour.
A) What is the pay rate, in dollars per hour? Round your answer to 2 decimal places.
B) How much will the worker earn for 33 hours of work?
C) How many hours will it take the worker to earn $5,500 in gross pay? Round your answer to the nearest hour.
(Short Answer)
4.8/5 (32)
A house that sold for $35,000 in 1980 sold for $60,500 in 2000.
A) Find the average rate of change of the value of the house per year.
B) If the house continues to increase in value at the same rate, what will be its value in 2016?
(Essay)
4.9/5 (37)
The function,  , gives the speed (in miles per hour), s, of a car at time t minutes.
What are the units of the 30 in the formula?
, gives the speed (in miles per hour), s, of a car at time t minutes.
What are the units of the 30 in the formula?
(Short Answer)
4.8/5 (32)
The table below is a data set corresponding to the times achieved every 10 meters by Carl Lewis in the 100 meter final of the World Championships in Rome in 1987.
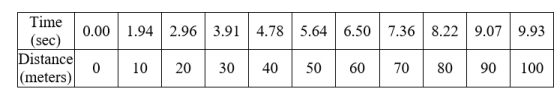 Find Carl Lewis's average speed (in meters per second) from the 30-meter mark to the 60-meter mark.
Round your answer to 2 decimal places.
Find Carl Lewis's average speed (in meters per second) from the 30-meter mark to the 60-meter mark.
Round your answer to 2 decimal places.
(Short Answer)
4.8/5 (44)
Which choice best describes the function,  , whose graph is pictured?
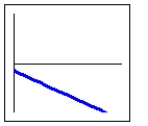
(Multiple Choice)
4.9/5 (37)
Use the following to answer questions
The following graph shows the percent of families in the U.S. living below the poverty level by year.
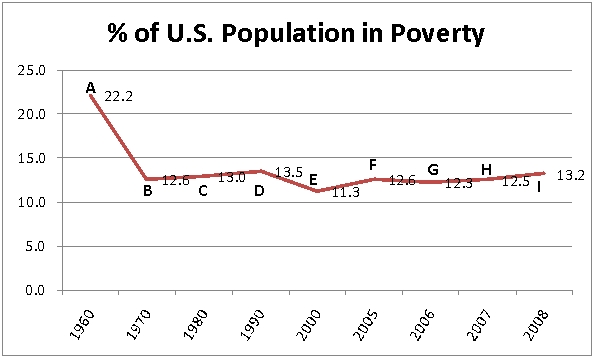 -Which pair of points would be used to show the most rapid increase in the number of families living in poverty?
(Multiple Choice)
4.8/5 (30)
Use the following to answer questions
The following graph shows the percent of families in the U.S. living below the poverty level by year.
-Which pair of points would be used to show the most rapid decrease in the number of families living in poverty?
(Multiple Choice)
5.0/5 (29)
The following table gives the average daily intake of animal fats in grams per day and the age-adjusted death rate from breast cancer per 100,000 women.
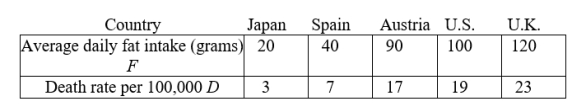 A) Use the regression capability of your calculator to find a formula for D as a function of F.
B) Use the function to predict the death rate from breast cancer in Mexico where the average daily fat intake is F = 23 grams.
C) Use the function to estimate the average daily fat intake in a country where there are 15 deaths from breast cancer for every 100,000 women.
A) Use the regression capability of your calculator to find a formula for D as a function of F.
B) Use the function to predict the death rate from breast cancer in Mexico where the average daily fat intake is F = 23 grams.
C) Use the function to estimate the average daily fat intake in a country where there are 15 deaths from breast cancer for every 100,000 women.
(Short Answer)
4.9/5 (38)
The joint plates of a wooden truss require 1 nail for every 30 pounds of stress on the joint. How many pounds can a joint with 28 nails in the joint plate hold?
(Short Answer)
4.9/5 (37)
Assuming that the line through the given two points has the given slope m, find the value of t.
(-6,-58) and (t,-88); m = 10
(Short Answer)
4.9/5 (23)
The table below gives a girl's height (in inches) as a function of the child's age.
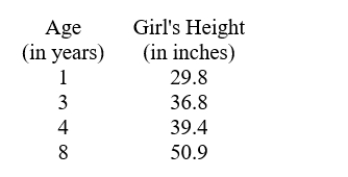 Use the data in the table and the average rates of change of height (in inches) to choose the best prediction for a girl's height (in inches) at age 10.
(Multiple Choice)
5.0/5 (27)
Suppose the slope of a line is -5 and the line goes through the point (-6, 25).
Find the values of a, b, and c if points (-1,a), (0,b), and (-10,c) are on the line.
(Short Answer)
4.8/5 (33)
Construct an equation of the form y = b + mx, with slope = -6 and vertical intercept = 0.
(Short Answer)
4.7/5 (26)
Filters
- Essay(0)
- Multiple Choice(0)
- Short Answer(0)
- True False(0)
- Matching(0)