Exam 1: An Introduction to Data and Functions
Exam 1: An Introduction to Data and Functions149 Questions
Exam 2: Rates of Change and Linear Functions215 Questions
Exam 3: When Lines Meet: Linear Systems81 Questions
Exam 4: The Laws of Exponents and Logarithms: Measuring the Universe201 Questions
Exam 5: Growth and Decay: An Introduction to Exponential Functions146 Questions
Exam 6: Logarithmic Links: Logarithmic and Exponential Functions108 Questions
Exam 7: Power Functions109 Questions
Exam 8: Quadratics and the Mathematics of Motion127 Questions
Exam 9: New Functions From Old137 Questions
Select questions type
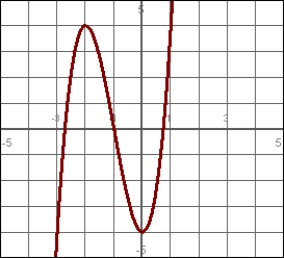
Which graph is increasing on the interval and decreasing on the interval (2,4)? 
Free
(Multiple Choice)
4.8/5  (30)
(30)
Correct Answer: Verified
A
Use technology to graph the function and then determine the interval on which the graph is concave downward. State your answer in interval notation.
y = 4.75x4 - 114x2
Free
(Short Answer)
4.9/5 (37)
Correct Answer:Verified
(-2, 2)
The following three graphs describe two cars, A and B.
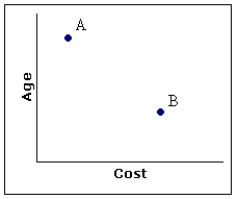
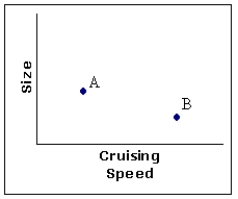
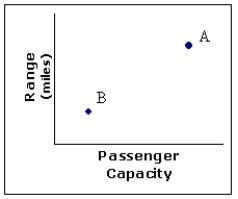 Which of the following is true?
Free
(Multiple Choice)
4.9/5 (43)
Correct Answer:Verified
A
Find the domain of the function, .
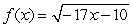 Write your answer in interval notation using fractions.
(Essay)
4.8/5 (36)
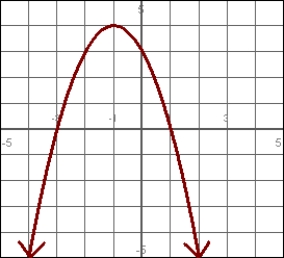
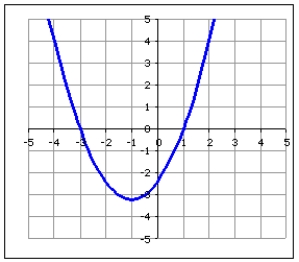
Determine the range of this graph. Express the answer in interval notation.
(Essay)
4.8/5 (34)
Use the graph below to answer the questions.
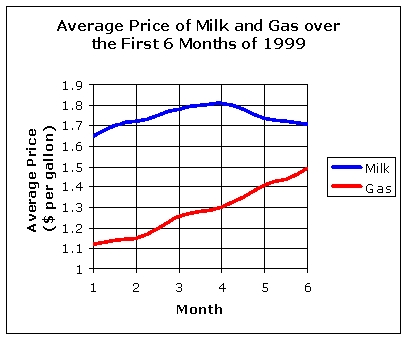 -
In what month did milk prices reach $1.79 per gallon?
-
In what month did milk prices reach $1.79 per gallon?
(Multiple Choice)
4.8/5 (24)
Determine if this set of points represents a function.
(7, 10), (6, -1), (-4, -6), (-8, -3), (4, -8)
(Multiple Choice)
4.9/5 (32)
The following grid shows the graph of the function,  .
.
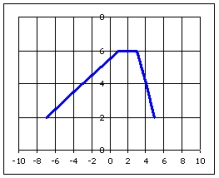 Find the range of the function.
(Multiple Choice)
4.8/5 (31)
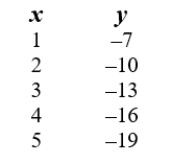
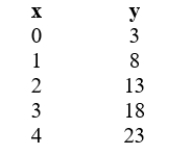
Find an equation that represents the relationship between x and y in this table:
(Short Answer)
4.8/5 (32)
Find the median of the data set below.
39, 71, 59, 42, 22, 66, 51, 75, 35, 68
(Multiple Choice)
4.8/5 (26)
Which graph is decreasing on the interval (-1,2) and increasing on the interval (2,4)?
(Multiple Choice)
4.9/5 (34)
Use technology to graph the function and then determine the interval over which the function is decreasing. State your answer in interval notation.
y = x4 - 8x2
(Essay)
4.9/5 (39)
Find the value that completes the ordered pair, (-2,__), satisfies the equation.

(Short Answer)
4.8/5 (42)
In the situation below, identify
A) the independent (input) variable, and
B) the dependent (output) variable.
Enter the variable only.
At the bookstore the total bill (b) is a function of the number of pencils you buy (p).
(Short Answer)
4.8/5 (30)
Over what interval is the function increasing?
Write your answer in interval notation.
(Essay)
4.8/5 (38)
For the following data, find a formula that expresses y in terms of x.
(Essay)
4.9/5 (34)
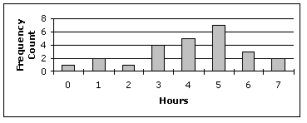
Use the bar chart below to find the mean of the data set, rounded to 2 decimal places if necessary.
(Multiple Choice)
4.9/5 (38)
State the interval on which this graph is concave downward. State your answer in interval notation.
(Essay)
4.8/5 (33)
Filters
- Essay(0)
- Multiple Choice(0)
- Short Answer(0)
- True False(0)
- Matching(0)