Exam 2: Rates of Change and Linear Functions
Exam 1: An Introduction to Data and Functions149 Questions
Exam 2: Rates of Change and Linear Functions215 Questions
Exam 3: When Lines Meet: Linear Systems81 Questions
Exam 4: The Laws of Exponents and Logarithms: Measuring the Universe201 Questions
Exam 5: Growth and Decay: An Introduction to Exponential Functions146 Questions
Exam 6: Logarithmic Links: Logarithmic and Exponential Functions108 Questions
Exam 7: Power Functions109 Questions
Exam 8: Quadratics and the Mathematics of Motion127 Questions
Exam 9: New Functions From Old137 Questions
Select questions type
The number of students enrolled in higher education in the state of Kentucky for the years from 1985 through 1992 is displayed in the following table.
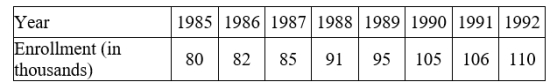 Complete the sentence:
Between 1989 and 1992, the enrollment increased by an average of _________ students each year.
Round answers to 2 decimal places if necessary.
Complete the sentence:
Between 1989 and 1992, the enrollment increased by an average of _________ students each year.
Round answers to 2 decimal places if necessary.
(Multiple Choice)
4.9/5  (36)
(36)
y is directly proportional to x and y is 20.8 when x is 4.
A) Find a formula to describe y as a function of x.
B) Use the formula to find y when x is 12.
(Short Answer)
4.7/5 (27)
The average costs, by year, of a 3 bedroom, 2 bath, single-family house in Chetek, WI, are listed in this table.
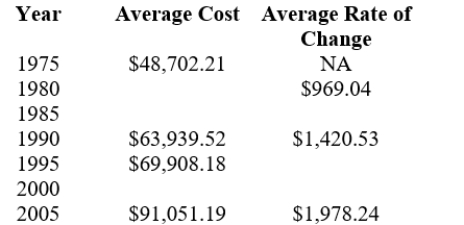 Fill in the missing number in the table for each time period. (Round each answer to 2 decimal places.)
(Short Answer)
4.9/5 (34)
The distance traveled (in miles), D, is directly proportional to time traveled (in minutes), t.
If you traveled 19.2 miles in 24 minutes, find your distance traveled (in miles) if you've traveled for 53 minutes.
(Short Answer)
4.9/5 (32)
Find the equation of the line for the following set of conditions.
The line is a vertical line that passes through the point (-5,2).
(Essay)
4.9/5 (37)
State whether the data shown in the table is exactly linear or approximately linear. 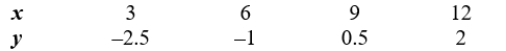
(Multiple Choice)
4.8/5 (28)
Find the value of y such that the line that passes through the points (0, y ) and (16,14) has a slope of  .
.
(Short Answer)
4.9/5 (29)
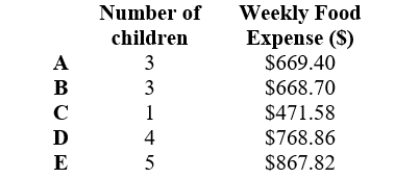
Create an estimate of a linear model for this data. Use points B and D from this table to estimate the slope, and then use point B to estimate the vertical intercept. Round the answers to 2 decimal places.
(Short Answer)
4.8/5 (34)
The graph below displays the population of the Madison, WI by decade.
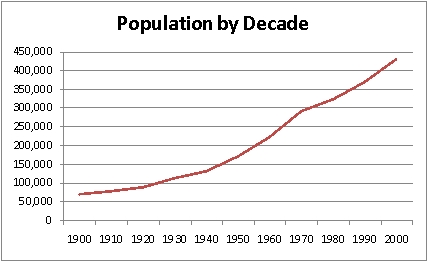 What would the units of the rate of change be?
(Multiple Choice)
4.9/5 (26)
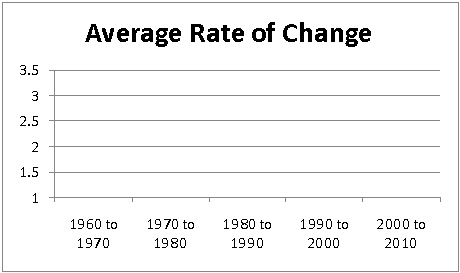
The following table gives information about the population of Barron County by decade.
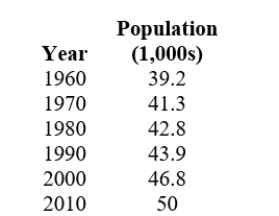 Construct a graph of the average rate of change by decade.
(Essay)
4.9/5 (33)
Find a linear equation that describes the statement.
A cat is born (age 0) weighing 3.8 ounces and at 8 years of age the cat weighs 148.6 ounces.
Write your answer in slope-intercept form,  , in terms of weight, w, and age, a.
(Essay)
4.8/5 (28)
Find the equation of the line for the following set of conditions.
The the line passes through the points (-5,34) and (4,-11).
Write the answer in slope-intercept form,  .
.
(Essay)
4.7/5 (31)
Assuming that the line through the given two points has the given slope m, find the value of t.
(t, 5) and (-8, 2); m =  .
.
(Short Answer)
4.7/5 (38)
Filters
- Essay(0)
- Multiple Choice(0)
- Short Answer(0)
- True False(0)
- Matching(0)