Exam 3: Data Visualization and Summary Measures
Exam 1: Introduction to Business Analytics44 Questions
Exam 2: Data Management and Wrangling46 Questions
Exam 3: Data Visualization and Summary Measures52 Questions
Exam 4: Probability and Probability Distributions50 Questions
Exam 5: Statistical Inference53 Questions
Exam 6: Regression Analysis53 Questions
Exam 7: Advanced Regression Analysis52 Questions
Exam 8: Introduction to Data Mining54 Questions
Exam 9: Supervised Data Mining: K-Nearest Neighbors and Naãve Bayes54 Questions
Exam 10: Supervised Data Mining: Decision Trees51 Questions
Exam 11: Unsupervised Data Mining53 Questions
Exam 12: Forecasting With Time Series Data53 Questions
Exam 13: Introduction to Prescriptive Analytics49 Questions
Select questions type
The interquartile range is IQR = Q3 - Q1. Thus, it can be thought of as
Free
(Multiple Choice)
4.7/5  (37)
(37)
Correct Answer: Verified
C
Bill wants to calculate the width of each interval by using the approximation formula. He first created a frequency distribution with 4 intervals. The minimum and maximum for the variable are -31.1 and 65.42 respectfully. Calculate the width of each interval for Bill.
Free
(Multiple Choice)
4.8/5 (47)
Correct Answer:Verified
C
The degree of strength of the linear relationship between x and y is called?
Free
(Multiple Choice)
4.9/5 (43)
Correct Answer:Verified
D
Carmen is a professor at a local university. In collecting data on her Introduction to Business course for a year, she wants to calculate the z-score for a student who scores a 90 on the final exam. The mean and the standard deviation scores on the exam are 76 and 6, respectively. Calculate the z-score.
(Multiple Choice)
4.9/5 (30)
When working with numerical variables, the frequency distribution is equal to the number of observations that falls into each interval.
(True/False)
4.7/5 (33)
Bill wants to calculate the width of each interval by using the approximation formula. He first created a frequency distribution with 5 intervals. The minimum and maximum for the variable are -32.4 and 65.42 respectfully. Calculate the width of each interval for Bill.
(Multiple Choice)
4.7/5 (33)
The following table is the summary statistics for Scores. Calculate the Sharpe ratio of growth. Assume Rf = 4. 
(Multiple Choice)
4.8/5 (26)
A scatterplot with a categorical variable allows for the dynamic view of the addition of a categorical variable to the numeric plot points adding an additional layer of visible detail.
(True/False)
4.9/5 (44)
Alex is working on an investment portfolio reviewing Gas and Diesel summary statistics. Which investment would be the better risk per unit, assuming Rf = 2? 
(Multiple Choice)
4.8/5 (41)
Using the following table, what is the percent of the relative frequency of a Blue car being observed? 
(Multiple Choice)
4.9/5 (40)
In a scatter plot diagram, if there is no discernable pattern, then there is a positive relationship between the numerical variables.
(True/False)
4.9/5 (33)
As observations become more dispersed, the difference between the minimum and maximum observation of a variable is called __________.
(Multiple Choice)
4.9/5 (39)
Marin produced the following histogram based on his observations on the age of players willing to sample a video game. He then organized the age into frequencies and interval width of the respective intervals. Based on the results, which range has the best frequency for future video game sampling? 
(Multiple Choice)
4.9/5 (33)
The mean credit score is 640 out of 300 used car loan applicants with a standard deviation of 16. Assuming a bell-shaped curve, what is the number of loan applicants that fall within a score of 608 and 672?
(Multiple Choice)
4.7/5 (41)
In analyzing the S&P 500 and the XYZ Inc. in a five-year study, the covariance (S&P 500, XYZ Inc.) is 9,107.30. What kind of linear relationship does the S&P 500 and the XYZ Inc. have?
(Multiple Choice)
4.9/5 (43)
Survey Results provided the skewness coefficient is -0.141974 and the (excess) kurtosis coefficient is 1.15926. These values imply that the return value for Survey is _______ skewed, and the distribution has a _____ tail than a normal distribution.
(Multiple Choice)
4.8/5 (33)
Using the following Boxplot, identify the median score on the test. 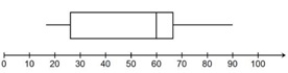
(Multiple Choice)
4.9/5 (46)
Central location is defined as the way numerical data tends to cluster around a middle or central value.
(True/False)
4.8/5 (33)
What is the arithmetic mean in the following table on the variable score? 
(Multiple Choice)
4.9/5 (47)
Filters
- Essay(0)
- Multiple Choice(0)
- Short Answer(0)
- True False(0)
- Matching(0)