Exam 3: Data Visualization and Summary Measures
Exam 1: Introduction to Business Analytics44 Questions
Exam 2: Data Management and Wrangling46 Questions
Exam 3: Data Visualization and Summary Measures52 Questions
Exam 4: Probability and Probability Distributions50 Questions
Exam 5: Statistical Inference53 Questions
Exam 6: Regression Analysis53 Questions
Exam 7: Advanced Regression Analysis52 Questions
Exam 8: Introduction to Data Mining54 Questions
Exam 9: Supervised Data Mining: K-Nearest Neighbors and Naãve Bayes54 Questions
Exam 10: Supervised Data Mining: Decision Trees51 Questions
Exam 11: Unsupervised Data Mining53 Questions
Exam 12: Forecasting With Time Series Data53 Questions
Exam 13: Introduction to Prescriptive Analytics49 Questions
Select questions type
Candice is preparing for her final exam in Statistics. She knows she needs an 68 out of 100 to earn an A overall in the course. Her instructor provided the following information to the students.
- On the final, 200 students have taken it with a mean score of 60 and a standard deviation of 6. Assume the distribution of scores is bell-shaped. Calculate to see if a score of 68 is within one standard deviation of the mean.
(Multiple Choice)
4.9/5  (45)
(45)
An easy way to convert relative frequencies into percentages is by dividing by 100.
(True/False)
4.8/5 (40)
Carmen is a professor at a local university. In collecting data on her Introduction to Business course for a year, she wants to calculate the z-score for a student who scores a 84 on the final exam. The mean and the standard deviation scores on the exam are 70 and 6, respectively. Calculate the z-score.
(Multiple Choice)
4.8/5 (38)
In a large data set, the arithmetic mean is the primary measure of the central location.
(True/False)
4.8/5 (29)
Using the following Boxplot, what is the star to the far right considered? 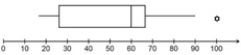
(Multiple Choice)
4.8/5 (38)
Converting observations into z-scores is also called doubling the observation.
(True/False)
4.8/5 (27)
A line chart displays the numerical variable of a series of data points connected by a line.
(True/False)
4.9/5 (34)
Using the following histogram, how would the distribution be described? 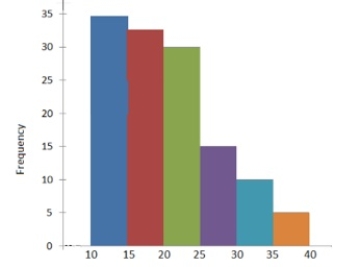
(Multiple Choice)
4.9/5 (37)
A study focused on the following numerical variables: Age, Income, and Candy (lbs). A bubble chart will help the researcher understand the relationship based on the location of the age and income plots and the size of the bubble based on candy consumption.
(True/False)
4.9/5 (36)
Constructing a contingency table allows for a clear visualization of the relationship between two categorical variables.
(True/False)
4.8/5 (39)
If the coefficient correlation is computed to be -0.15, this means the relationship between the two variables are _______.
(Multiple Choice)
4.7/5 (41)
The following table is the summary statistics for Scores. Calculate the Sharpe ratio of growth. Assume Rf = 4. 
(Multiple Choice)
4.9/5 (34)
Filters
- Essay(0)
- Multiple Choice(0)
- Short Answer(0)
- True False(0)
- Matching(0)