Exam 3: Data Visualization and Summary Measures
Exam 1: Introduction to Business Analytics44 Questions
Exam 2: Data Management and Wrangling46 Questions
Exam 3: Data Visualization and Summary Measures52 Questions
Exam 4: Probability and Probability Distributions50 Questions
Exam 5: Statistical Inference53 Questions
Exam 6: Regression Analysis53 Questions
Exam 7: Advanced Regression Analysis52 Questions
Exam 8: Introduction to Data Mining54 Questions
Exam 9: Supervised Data Mining: K-Nearest Neighbors and Naãve Bayes54 Questions
Exam 10: Supervised Data Mining: Decision Trees51 Questions
Exam 11: Unsupervised Data Mining53 Questions
Exam 12: Forecasting With Time Series Data53 Questions
Exam 13: Introduction to Prescriptive Analytics49 Questions
Select questions type
What is the arithmetic mean in the following table on the variable score? 
(Multiple Choice)
4.7/5  (32)
(32)
As a researcher, you should be mindful on constructing and interpreting graphs. All of the following are recommended guidelines you should follow except for one. Which one does not reflect a guideline?
(Multiple Choice)
4.9/5 (35)
The following scatterplot is of % of fat and BMI Index Score. What type of linear relationship is being displayed? 
(Multiple Choice)
5.0/5 (38)
Below is the Scatterplot of 2 numeric variables. What type of relationship is represented? 
(Multiple Choice)
4.8/5 (36)
Simone is a marketing consultant hired to review the product sales for a new high-end barista machine line. The product line has four variations, selling in four specialty store regions. To clearly show where each variation is selling best and in which regions, she plans to provide a color-scaled chart using percentage by type and location. What is the name of the chart she will be using?
(Multiple Choice)
4.8/5 (36)
If the coefficient correlation is computed to be -0.85, this means the relationship between the two variables are _______.
(Multiple Choice)
4.9/5 (36)
Using R, Bart wants to create a bar chart showing the frequency of the color of cars that pass over the I-270 overpass at the Main Street exit. What function should he use?
(Multiple Choice)
4.8/5 (29)
Alex is working on an investment portfolio reviewing Gas and Diesel summary statistics. Which investment would be the better risk per unit, assuming Rf = 2? 
(Multiple Choice)
4.8/5 (44)
The following chart represents the results of a two categorical variable study reflecting on education level survey in 2006 and the same survey results from 2016. Which type of chart is being displayed? 
(Multiple Choice)
4.9/5 (40)
The standard deviation of midterm scores and the final exam are 8 and 6, respectively. Which of the two exams offers more risk and why?
(Multiple Choice)
4.9/5 (39)
In the following Boxplot, the left whisker is longer than the right whisker. This indicates that the underlining distribution is _______. 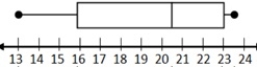
(Multiple Choice)
4.9/5 (42)
The mean credit score is 645 out of 310 used car loan applicants with a standard deviation of 17. Assuming a bell-shaped curve, what is the number of loan applicants that fall within a score of 611 and 679?
(Multiple Choice)
4.8/5 (36)
Using the following table, what is the percent of the relative frequency of a Blue car being observed? 
(Multiple Choice)
4.8/5 (42)
The standard deviation of midterm scores and the final exam are 10.0 and 7.0, respectively. Which of the two exams offers more risk and why?
(Multiple Choice)
5.0/5 (41)
What is the only meaningful measure of the central location for a categorical variable?
(Multiple Choice)
4.9/5 (38)
In analyzing the S&P 500 and the XYZ Inc. in a five-year study, the covariance (S&P 500, XYZ Inc.) is 4,254.40. What kind of linear relationship does the S&P 500 and the XYZ Inc. have?
(Multiple Choice)
4.8/5 (29)
Candice is preparing for her final exam in Statistics. She knows she needs an 80 out of 100 to earn an A overall in the course. Her instructor provided the following information to the students.
-On the final, 200 students have taken it with a mean score of 72 and a standard deviation of 6. Assume the distribution of scores is bell-shaped. Calculate to see if a score of 80 is within one standard deviation of the mean.
(Multiple Choice)
4.8/5 (33)
Filters
- Essay(0)
- Multiple Choice(0)
- Short Answer(0)
- True False(0)
- Matching(0)