Exam 12: Aggregate Demand and Aggregate Supply
Exam 1: Limits, Alternatives, and Choices21 Questions
Exam 2: The Market System and the Circular Flow11 Questions
Exam 3: Demand, Supply, and Market Equilibrium30 Questions
Exam 4: Elasticity of Demand and Supply23 Questions
Exam 5: Market Failures: Public Goods and Externalities12 Questions
Exam 6: Businesses and Their Costs15 Questions
Exam 7: Pure Competition6 Questions
Exam 8: Pure Monopoly17 Questions
Exam 9: Monopolistic Competition and Oligopoly16 Questions
Exam 10: GDP and Economic Growth39 Questions
Exam 11: Business Cycles, Unemployment, and Inflation40 Questions
Exam 12: Aggregate Demand and Aggregate Supply62 Questions
Exam 13: Fiscal Policy, Deficits, and Debt72 Questions
Exam 14: Money, Banking, and Financial Institutions58 Questions
Exam 15: Interest Rates and Monetary Policy69 Questions
Exam 16: International Trade and Exchange Rates28 Questions
Exam 17: Wage Determination17 Questions
Exam 18: Income Inequality and Poverty20 Questions
Select questions type
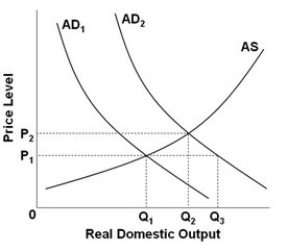 - Refer to the above diagram. When AD1 shifts to AD2, real output:
(Multiple Choice)
4.9/5  (39)
(39)
If a $100 billion increase in government spending results in a $500 billion increase in real GDP, then the value of the multiplier:
(Multiple Choice)
4.7/5 (34)
The following list contains factors that are related to the aggregate demand curve.
1) Household expectations
2) Profit expectations
3) Degree of excess capacity
4) Personal income tax rates
5) Exchange rates
6) National income abroad
7) Government spending
8) Household wealth
-
Refer to the above information. Investment spending would most likely be influenced by changes in:
(Multiple Choice)
4.9/5 (38)
A rightward shift of the aggregate demand curve will increase real domestic output and the price level in the short run.
(True/False)
4.9/5 (34)
The following list contains items that are related to aggregate demand and/or aggregate supply.
1) Government Spending
2) Consumer Expectations
3) Degree of Excess capacity
4) Personal Income Tax Rates
5) Productivity
6) National Income Abroad
7) Business Taxes
8) Domestic Resource Availability
9) Price of Imported Products
10) Profit Expectations on Investments
-
Refer to the above list. Changes in which of the above two factors would most likely cause a change in aggregate supply?
(Multiple Choice)
4.9/5 (34)
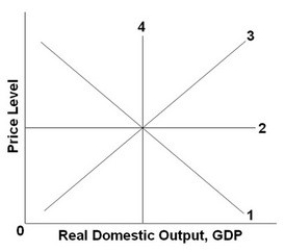 - Refer to the above graph. As the price level changes, real domestic output remains constant with which line?
(Multiple Choice)
4.9/5 (34)
When there is an increase in aggregate demand in the long run, there will be an increase in the price level but not in the level of output or employment.
(True/False)
4.8/5 (30)
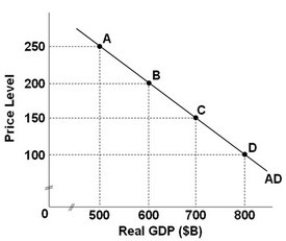 - Refer to the above graph, which shows an aggregate demand curve for a hypothetical economy. If the price level is 200, the quantity of real GDP demanded is:
(Multiple Choice)
4.9/5 (40)
 Refer to the above graph. The ratchet effect would suggest that:
(Multiple Choice)
4.8/5 (42)
A change in household indebtedness will cause a movement along an existing aggregate demand curve.
(True/False)
4.7/5 (34)
If the U.S. dollar appreciates in value relative to foreign currencies, then this will:
(Multiple Choice)
4.8/5 (27)
The following list contains factors that are related to the aggregate demand curve.
1) Household expectations
2) Profit expectations
3) Degree of excess capacity
4) Personal income tax rates
5) Exchange rates
6) National income abroad
7) Government spending
8) Household wealth
-
Changes in which three of the above factors would most likely cause a change in consumer spending?
(Multiple Choice)
4.9/5 (38)
If the prices of imported resources decrease, then this event would most likely:
(Multiple Choice)
4.9/5 (32)
The magnification of small changes in spending into larger changes in output and income is produced by:
(Multiple Choice)
4.7/5 (35)
A decrease in aggregate demand will have no effect on the real equilibrium GDP of the economy and will lower its price level in the short run.
(True/False)
4.8/5 (32)
The following list contains items that are related to aggregate demand and/or aggregate supply.
1) Government Spending
2) Consumer Expectations
3) Degree of Excess capacity
4) Personal Income Tax Rates
5) Productivity
6) National Income Abroad
7) Business Taxes
8) Domestic Resource Availability
9) Price of Imported Products
10) Profit Expectations on Investments
-
Refer to the above list. A change in which factor is most likely to change both aggregate demand and aggregate supply?
(Multiple Choice)
4.9/5 (48)
The massive increase in government spending during World War II moved the economy in the span of a few short years from mass unemployment and price stability to "overfull" employment and severe demand-pull inflation. This situation can be best characterized by:
(Multiple Choice)
4.8/5 (33)
In an economy it costs $1500 to produce 2000 units of output. If the costs increase to $2500, then the per-unit cost of production will have increased from:
(Multiple Choice)
4.7/5 (34)
Filters
- Essay(0)
- Multiple Choice(0)
- Short Answer(0)
- True False(0)
- Matching(0)