Exam 16: Web: Economics of Life, Health, and the Environment
Exam 1: Economic Methods and Optimization: Doing the Best You Can6 Questions
Exam 2: Demand, Supply, and Equilibrium7 Questions
Exam 3: Consumers and Incentives,the Wealth of Nations: Defining and Measuring Macroeconomic Aggregates45 Questions
Exam 4: Sellers and Incentives,aggregate Incomes29 Questions
Exam 5: Perfect Competition and the Invisible Hand, Economic Growth20 Questions
Exam 6: Trade and Why Isnt the Whole World Developed16 Questions
Exam 7: Externalities and Public Goods, Employment and Unemployment12 Questions
Exam 8: The Government in the Economy: Taxation and Regulation, Credit Markets25 Questions
Exam 9: Markets for Factors of Production and the Monetary System21 Questions
Exam 10: Monopoly and Short-Run Fluctuations13 Questions
Exam 11: Game Theory and Strategic Play8 Questions
Exam 12: Oligopoly and Monopolistic Competition15 Questions
Exam 13: Trade-Offs Involving Time and Risk and Open Economy Macroeconomics28 Questions
Exam 14: Social Economics and Auctions and Bargaining13 Questions
Exam 15: Web: Financial Decision Making31 Questions
Exam 16: Web: Economics of Life, Health, and the Environment68 Questions
Exam 17: Web: Political Economy76 Questions
Select questions type
The diagram below shows the demand curve, supply curve, and the marginal social cost curve for a manufacturing unit.
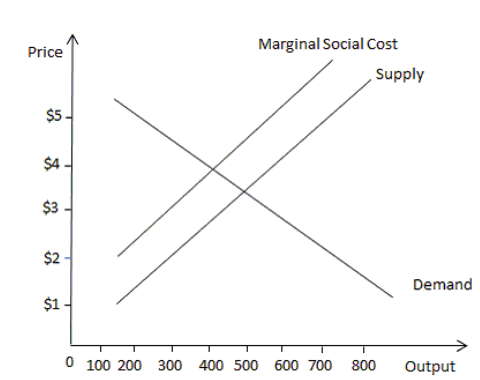 -Refer to the scenario above. If the government imposes a tax of _______,output will ______.
(Multiple Choice)
4.7/5  (31)
(31)
The figure below shows the marginal pollution abatement costs of two companies - Alpha Electric and Beta Inc.
 -Refer to the scenario above. Suppose the government allocates 250 pollution permits to each company and the price of each permit is $200. ________ will spend ________on buying permits.
(Multiple Choice)
4.8/5 (34)
The figure below shows the marginal pollution abatement costs of two companies - Alpha Electric and Beta Inc.
-Refer to the figure above. Assume that firms are allowed to buy and sell permits. If the government allocates 200 pollution permits to each company and the price of each permit is $300, Beta Inc. will reduce its emission to ________.
(Multiple Choice)
4.7/5 (40)
The figure below shows the marginal pollution abatement costs of two companies - Alpha Electric and Beta Inc.
-Refer to the figure above. If the government sets a pollution cap of 200 tons of emission, Alpha Electric will incur an abatement cost of ________.
(Multiple Choice)
4.8/5 (39)
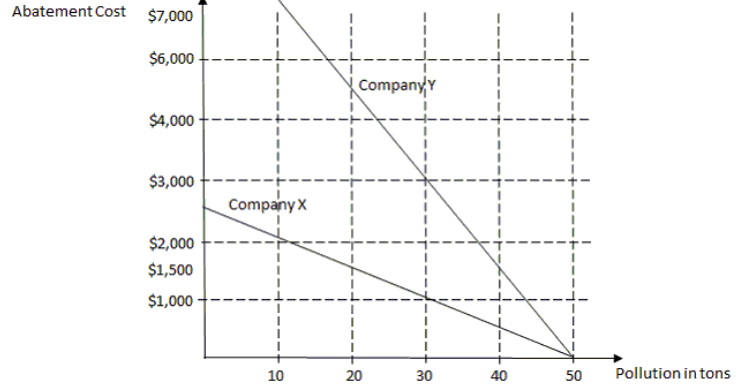
The figure below shows the marginal pollution abatement cost curves of two firms- Company X and Company Y.
 -Refer to the figure above. If the government sets a pollution cap of 30 tons of emission per firm, Company X will incur an abatement cost of ________.
(Multiple Choice)
4.9/5 (34)
The figure below shows the marginal pollution abatement cost curves of two firms- Company X and Company Y.
-Refer to the figure above. Which of the following will happen if the government allocates 30 pollution permits to each company and the price of each permit is $1,500?
(Multiple Choice)
4.7/5 (47)
Filters
- Essay(0)
- Multiple Choice(0)
- Short Answer(0)
- True False(0)
- Matching(0)