Exam 14: Data Analysis: Preliminary Steps
Exam 1: Marketing Research: Its Everywhere10 Questions
Exam 2: Alternative Approaches to Marketing Intelligence7 Questions
Exam 3: The Research Process and Problem Formulation19 Questions
Exam 4: Research Design, Exploratory Research, and Qualitative Data23 Questions
Exam 5: Descriptive Research21 Questions
Exam 6: Causal Designs78 Questions
Exam 7: Data Collection: Secondary Data21 Questions
Exam 8: Data Collection: Primary Data16 Questions
Exam 9: Questionnaires and Data Collection Forms6 Questions
Exam 10: Attitude Measurement34 Questions
Exam 10: Appendix 10: Psychological Measurement15 Questions
Exam 11: Sampling Procedures15 Questions
Exam 12: Sample Size11 Questions
Exam 13: Collecting the Data: Field Procedures and Nonsampling Error22 Questions
Exam 14: Data Analysis: Preliminary Steps34 Questions
Exam 14: Appendix 14: Chi-Square Tests26 Questions
Exam 15: Data Analysis: Basic Questions26 Questions
Exam 15: Appendix 15 A: Quick Stats Review24 Questions
Exam 16: Data Analysis: Examination of Differences14 Questions
Exam 16: Appendix 16 A: Analysis of Variance33 Questions
Exam 17: Data Analysis: Investigation of Association47 Questions
Exam 18: Multivairate Data Analysis: Discriminant Analysis, Factor Analysis, Cluster Analysis, and Multidimensional Scaling86 Questions
Exam 18: Appendix: More Multivariate Statistical Techniques8 Questions
Exam 19: The Research Report9 Questions
Select questions type
(Use the following one-way tabulation to answer the next three questions.)
Value Frequency
1 12
2 15
3 8
4 7
-What is the mean of the distribution for this variable?
Free
(Multiple Choice)
5.0/5  (49)
(49)
Correct Answer: Verified
C
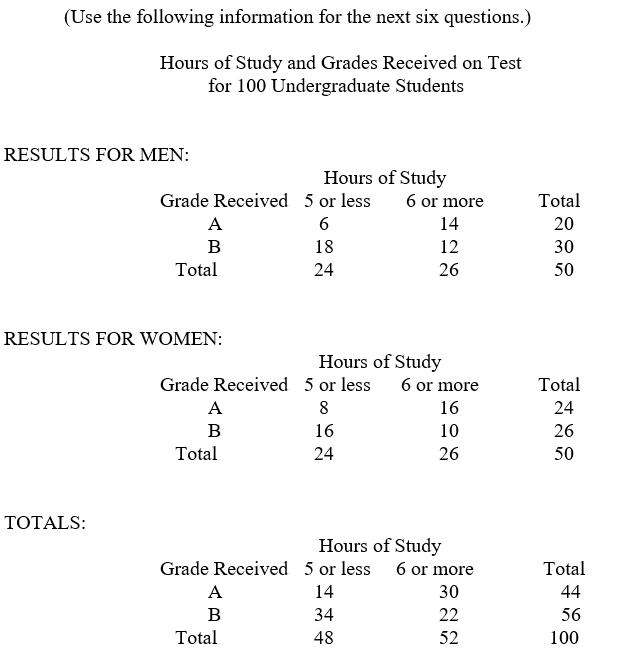 -In a chart of the cross-tabulation of "sex" vs. "grade received," which of the following sets of numbers would be marginals?
Free
(Multiple Choice)
4.9/5 (29)
Correct Answer:Verified
B
Which of the following statements are NOT true of the Kolmogorov-Smirnov (K-S) test with respect to the chi-square goodness-of-fit test?
Free
(Multiple Choice)
4.7/5 (31)
Correct Answer:Verified
C
-For men only, the impact of studying six hours or more on the probability of making an "A" is____, while for women this impact is___.This means that there is____between the independent variables.
(Multiple Choice)
4.9/5 (35)
(Use the following one-way tabulation to answer the next three questions.)
Value Frequency
1 12
2 15
3 8
4 7
-Approximately what is the standard deviation of the distribution for this variable?
(Multiple Choice)
4.9/5 (33)
Compared to the chi-square goodness-of -fit test, when the data are ordinal, the Kolmogorov-Smirnov test
(Multiple Choice)
4.9/5 (35)
The Kolmogorov-Smirnov test can be used to determine whether
(Multiple Choice)
4.9/5 (36)
Which of the following kinds of data should not be analyzed using the Kolmogorov-Smirnov test?
(Multiple Choice)
4.8/5 (37)
Which of the following is a disadvantage to using a banner table instead of a traditional cross tabulation?
(Multiple Choice)
4.8/5 (29)
(Use the following one-way tabulation to answer the next three questions.)
Value Frequency
1 12
2 15
3 8
4 7
-What is the mode of the distribution for this variable?
(Multiple Choice)
4.7/5 (38)
 -In the above table, which numbers are referred to as the marginals?
(Multiple Choice)
4.8/5 (37)
When coding data for computer analysis, which of the following is NOT recommended?
(Multiple Choice)
4.8/5 (45)
A useful device for determining whether the distribution of observed incomes is consistent with a theoretical or assumed distribution is the
(Multiple Choice)
4.8/5 (44)
-Considering only the results for the men, if the chart were to be expressed in terms of percentages, what percentage would be associated with the 18 men who received a "B" and studied five hours or less?
(Multiple Choice)
4.7/5 (45)
The addition of a third variable to an analysis between two variables might
(Multiple Choice)
4.9/5 (36)
You are a researcher conducting a cross-tabulation on three variables: sex (male, female), region of the country (east, west, north, south), and marital status (single, married, divorced, separated). Assuming an even allocation of observations to cells, how many observations are necessary for 20 per cell?
(Multiple Choice)
4.9/5 (36)
-The "totals" chart might also be called the_____between the variables "grade received" and "hours of study."
(Multiple Choice)
4.9/5 (41)
Filters
- Essay(0)
- Multiple Choice(0)
- Short Answer(0)
- True False(0)
- Matching(0)