Exam 14: Appendix 14: Chi-Square Tests
Exam 1: Marketing Research: Its Everywhere10 Questions
Exam 2: Alternative Approaches to Marketing Intelligence7 Questions
Exam 3: The Research Process and Problem Formulation19 Questions
Exam 4: Research Design, Exploratory Research, and Qualitative Data23 Questions
Exam 5: Descriptive Research21 Questions
Exam 6: Causal Designs78 Questions
Exam 7: Data Collection: Secondary Data21 Questions
Exam 8: Data Collection: Primary Data16 Questions
Exam 9: Questionnaires and Data Collection Forms6 Questions
Exam 10: Attitude Measurement34 Questions
Exam 10: Appendix 10: Psychological Measurement15 Questions
Exam 11: Sampling Procedures15 Questions
Exam 12: Sample Size11 Questions
Exam 13: Collecting the Data: Field Procedures and Nonsampling Error22 Questions
Exam 14: Data Analysis: Preliminary Steps34 Questions
Exam 14: Appendix 14: Chi-Square Tests26 Questions
Exam 15: Data Analysis: Basic Questions26 Questions
Exam 15: Appendix 15 A: Quick Stats Review24 Questions
Exam 16: Data Analysis: Examination of Differences14 Questions
Exam 16: Appendix 16 A: Analysis of Variance33 Questions
Exam 17: Data Analysis: Investigation of Association47 Questions
Exam 18: Multivairate Data Analysis: Discriminant Analysis, Factor Analysis, Cluster Analysis, and Multidimensional Scaling86 Questions
Exam 18: Appendix: More Multivariate Statistical Techniques8 Questions
Exam 19: The Research Report9 Questions
Select questions type
(Use the information below for the next two questions.)
A major car manufacturer was interested in whether its midsize car was selling consistently in two markets with respect to the annual income of the car purchasers. 500 new car buyers in Chicago and Miami were surveyed. In Chicago the following pattern was observed:
< $20,000 5%
$20,000-$29,999 20%
$30,000-$39,999 40%
$40,000-$49,999 30%
≥ $50,000 5%
Among those surveyed in Miami, 20 earned under $20,000; 70 earned between $20,000 and $30,000; 265 earned between $30,000 and $40,000; 125 earned between $40,000 and $50,000; and 20 earned more than $50,000.
-Using the data provided, the calculated value of  =
=
Free
(Multiple Choice)
4.8/5  (38)
(38)
Correct Answer: Verified
B
Which of the following statements pertaining to the index of predictive association is FALSE?
Free
(Multiple Choice)
4.8/5 (34)
Correct Answer:Verified
B
Which of the following statements pertaining to the contingency coefficient is FALSE?
Free
(Multiple Choice)
4.9/5 (30)
Correct Answer:Verified
C
 -How many degrees of freedom are associated with the above contingency table analysis?
(Multiple Choice)
4.9/5 (39)
A researcher had calculated the sample chi-square test statistic to be equal to ?2 = 7.71. For an alpha level of .10 (i.e., alpha = .10) and 4 degrees of freedom, the critical value of the chi-square statistic is 7.78. The appropriate conclusion is that
(Multiple Choice)
4.9/5 (35)
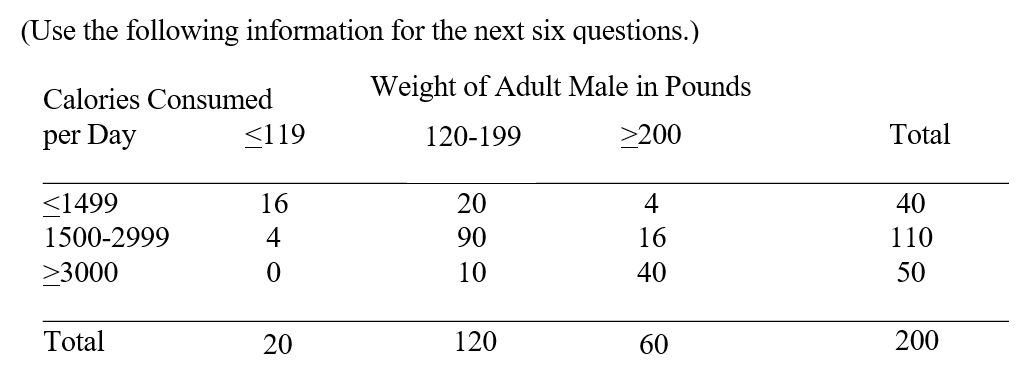
-Given no information about the weight of adult males, what is the best estimate of the number of calories consumed per day by adult males?
(Multiple Choice)
4.7/5 (45)
In a two-way contingency table with four rows and four columns, the appropriate degrees of freedom for the chi-square test statistic is
(Multiple Choice)
4.8/5 (39)
The upper and lower limits of the contingency coefficient are
(Multiple Choice)
4.8/5 (29)
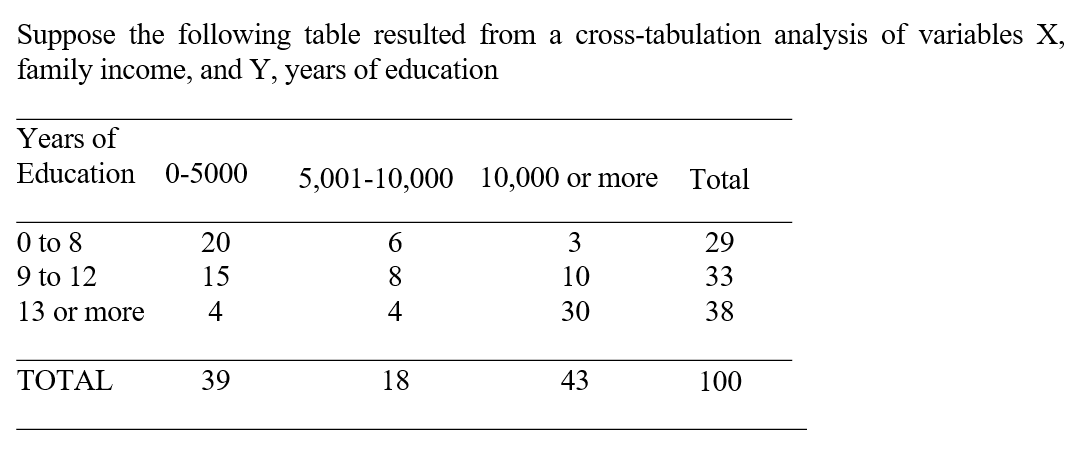 -Given
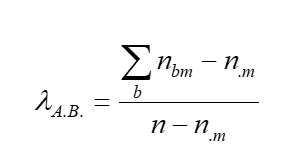 when predicting the A classification from the B classification, the index of predictive association for the above data is
(Multiple Choice)
4.9/5 (33)
-Suppose that you are predicting the number of calories consumed by adult males by the weight of adult males. Calculate the index of predictive association.
(Multiple Choice)
4.9/5 (39)
-Based on the above information, calculate the expected number of adult males who weigh 200 lbs. or more and consume 3000 or more calories per day.
(Multiple Choice)
4.9/5 (42)
-Assume that all expected frequencies have been computed. What is the next step in the contingency table analysis?
(Multiple Choice)
4.8/5 (38)
-What percentage of the predictions about calorie consumption would be made correctly by taking weight into account?
(Multiple Choice)
4.8/5 (32)
An analyst wishes to analyze a set of nominal data to determine if some observed pattern of frequencies is in accord with a stated null hypothesis. The preferred statistical technique is:
(Multiple Choice)
4.9/5 (35)
Which of the following statements regarding contingency tables is FALSE?
(Multiple Choice)
4.8/5 (42)
Which statement(s) pertaining to the chi-square distribution is true?
(Multiple Choice)
4.9/5 (45)
A researcher interested in measuring the association between two nominally scaled attributes should use
(Multiple Choice)
4.9/5 (35)
Filters
- Essay(0)
- Multiple Choice(0)
- Short Answer(0)
- True False(0)
- Matching(0)