Exam 3: Measures of Central Tendency and Dispersion
Exam 1: Introduction29 Questions
Exam 2: Basic Descriptive Statistics: Percentages, Ratios and Rates, Tables, Charts, and Graphs34 Questions
Exam 3: Measures of Central Tendency and Dispersion58 Questions
Exam 4: The Normal Curve28 Questions
Exam 5: Introduction to Inferential Statistics: Sampling and the Sampling Distribution34 Questions
Exam 6: Estimation Procedures for Sample Means and Proportions29 Questions
Exam 7: Hypothesis Testing With Nominal and Ordinal Variables: CHI Square31 Questions
Exam 8: Measures of Association for Variables Measured at the Nominal Level43 Questions
Exam 9: Measures of Association for Variables Measured at the Ordinal Level30 Questions
Exam 10: Hypothesis Testing With Means and Proportions: The One-Sample Case37 Questions
Exam 11: Hypothesis Testing With Means and Proportions: The Two-Sample Case31 Questions
Exam 12: Hypothesis Testing With More Than Two Means: One-Way Analysis of Variance30 Questions
Exam 13: Hypothesis Testing and Measures of Association for Variables Measured at the Interval-Ratio Level36 Questions
Exam 14: Partial Correlation and Multiple Regression and Correlation32 Questions
Select questions type
What is one advantage of the interquartile range (Q) over the range (R)?
(Multiple Choice)
4.8/5  (40)
(40)
Which of these terms is the preferred measure of central tendency for the variable income distribution, which almost always has a positive skew?
(Multiple Choice)
4.8/5 (42)
Which of these variables would be most appropriate for calculating the interquartile range?
(Multiple Choice)
4.8/5 (44)
Table 3.3 Means and Standard Deviations in Monthly Accident Events for Two Mining Companies, 2014-2018
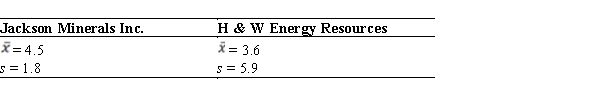 -Refer to Table 3.3. Which of the following could we conclude from these data?
(Multiple Choice)
4.8/5 (35)
Which of the following always happens when the mean is subtracted from a set of numbers, and all the differences are summed?
(Multiple Choice)
4.8/5 (37)
According to the text, why is the mode sometimes not a good representation of the typical score in a distribution?
(Multiple Choice)
4.9/5 (41)
Table 3.1 Data Set of Six Volunteers at a Charitable Organization
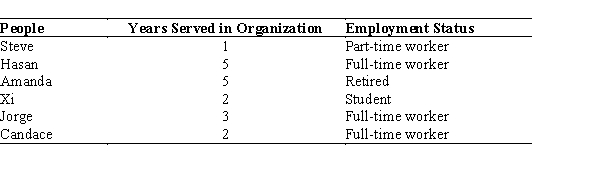 -Refer to Table 3.1. What is the mode of employment status?
(Multiple Choice)
4.8/5 (38)
On a survey, age was divided into three categories: younger than 18 years, 18 to 21 years, and older than 21 years. The researcher computed the mean age of the respondents by adding up the scores and then dividing by the number of cases. Why was this a mistake?
(Multiple Choice)
4.8/5 (31)
The distribution of student test scores is severely left skewed. What would this mean?
(Multiple Choice)
4.9/5 (36)
An army recruit scored in the 80th percentile of incoming soldiers for a fitness test. What can we conclude about that soldier?
(Multiple Choice)
4.9/5 (43)
Researchers wish to compare the dispersion of student grades across eight universities of varying sizes. What strategy would allow them to properly compare grade dispersion across the eight distributions?
(Multiple Choice)
4.9/5 (38)
Which set of scores shows the greatest level of dispersion?
(Multiple Choice)
4.7/5 (44)
Suppose a distribution has an outlying value far smaller than the other values in the distribution. What will happen to the standard deviation if the outlier is removed?
(Multiple Choice)
4.9/5 (40)
Which of these statements describes the "least squares" principle?
(Multiple Choice)
4.8/5 (34)
What is the difference between central tendency and dispersion in a distribution of data?
(Essay)
4.8/5 (35)
Filters
- Essay(0)
- Multiple Choice(0)
- Short Answer(0)
- True False(0)
- Matching(0)