Exam 2: Basic Descriptive Statistics: Percentages, Ratios and Rates, Tables, Charts, and Graphs
Exam 1: Introduction29 Questions
Exam 2: Basic Descriptive Statistics: Percentages, Ratios and Rates, Tables, Charts, and Graphs34 Questions
Exam 3: Measures of Central Tendency and Dispersion58 Questions
Exam 4: The Normal Curve28 Questions
Exam 5: Introduction to Inferential Statistics: Sampling and the Sampling Distribution34 Questions
Exam 6: Estimation Procedures for Sample Means and Proportions29 Questions
Exam 7: Hypothesis Testing With Nominal and Ordinal Variables: CHI Square31 Questions
Exam 8: Measures of Association for Variables Measured at the Nominal Level43 Questions
Exam 9: Measures of Association for Variables Measured at the Ordinal Level30 Questions
Exam 10: Hypothesis Testing With Means and Proportions: The One-Sample Case37 Questions
Exam 11: Hypothesis Testing With Means and Proportions: The Two-Sample Case31 Questions
Exam 12: Hypothesis Testing With More Than Two Means: One-Way Analysis of Variance30 Questions
Exam 13: Hypothesis Testing and Measures of Association for Variables Measured at the Interval-Ratio Level36 Questions
Exam 14: Partial Correlation and Multiple Regression and Correlation32 Questions
Select questions type
Which of the following should be reflected in a frequency distribution?
Free
(Multiple Choice)
4.7/5  (36)
(36)
Correct Answer: Verified
D
Table 2.1 Age of Respondents
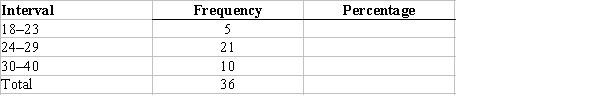 -According to Table 2.1, what is the width of each interval if 60 cases range in score from 4 to 84, and 10 intervals in a frequency distribution are wanted?
Free
(Multiple Choice)
4.9/5 (37)
Correct Answer:Verified
B
Table 2.2 Number of Prior Convictions among Inmates at a Prison
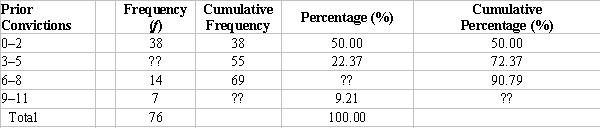 -Which of the following best characterizes the values in the prior convictions column in Table 2.2.
Free
(Multiple Choice)
4.8/5 (33)
Correct Answer:Verified
B
Table 2.2 Number of Prior Convictions among Inmates at a Prison
-What would be an ideal graph to represent the data shown in Table 2.2?
(Multiple Choice)
5.0/5 (48)
A company has 8 entry-level workers and 4 managers. What is the ratio of managers to entry-level workers?
(Multiple Choice)
4.9/5 (31)
The variable "number of fitness centres" across 25 districts of a large city ranges from 3 to 23. How wide should the interval width be if we desired 5 intervals?
(Multiple Choice)
4.8/5 (34)
A researcher presents a figure to depict how many heroin sales were made last year by members of a large gang. Interval values for the variable border each other, representing the data as a continuous series. What type of graphing technique is the researcher using?
(Multiple Choice)
4.8/5 (44)
Table 2.2 Number of Prior Convictions among Inmates at a Prison
-In Table 2.2, what would be the value for the cumulative percentage corresponding to the 9-11 prior conviction group?
(Multiple Choice)
4.9/5 (35)
Table 2.2 Number of Prior Convictions among Inmates at a Prison
-In Table 2.2, what percentage of cases are in the 6-8 prior conviction group?
(Multiple Choice)
4.9/5 (39)
In June 2014, the entire province of Manitoba had a population of 985,900 working-age adults, and 668,300 of them were participating in the labour force. What percentage of the working-age population was participating in the labour force?
(Multiple Choice)
4.9/5 (32)
Why do researchers commonly use intervals when representing frequency distributions for interval-ratio variables, and what principles should guide them when constructing such frequency distributions?
• Interval-ratio variables tend to have many possible values. Aggregating a range of values helps provide a more manageable way to understand how the variable is distributed rather than showing the frequency of every possible score.
• Scores should be grouped to maximize clarity and ease of comprehension. A general guiding principle is that one should balance detail (a large number of narrow categories) with compactness (a smaller number of wide categories).
• Another general rule for using intervals is that they should be equal in size.
(Essay)
4.7/5 (34)
Which of the following is a requirement for creating a frequency distribution?
(Multiple Choice)
4.9/5 (38)
Which of these distributions appropriately illustrates real limits?
(Multiple Choice)
4.8/5 (37)
Why do frequency distributions of interval-ratio-level data seldom contain more than 15 intervals?
(Multiple Choice)
4.8/5 (40)
Below are skills test scores for applicants of a software engineering job. Put the data into a frequency distribution using intervals of size 8. Include columns for percentages and cumulative percentages.
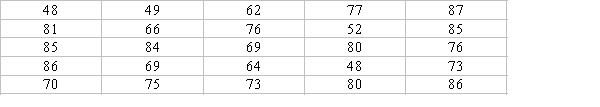
(Essay)
4.9/5 (39)
What would be the appropriate graph to show the distribution of Canadian-born versus non-Canadian-born students in an introductory economics class?
(Multiple Choice)
4.9/5 (34)
An environmental scientist reports that the proportion of lakes in a region that are contaminated by pollution is 0.28. How would this value be written as a percentage?
(Multiple Choice)
4.9/5 (36)
The intervals below represent ages of respondents. Which set of intervals is both exhaustive and mutually exclusive?
(Multiple Choice)
4.8/5 (33)
Filters
- Essay(0)
- Multiple Choice(0)
- Short Answer(0)
- True False(0)
- Matching(0)