Exam 4: Summarizing Data: Measures of Variation
Exam 1: Introduction37 Questions
Exam 2: Summarizing Data: Listing and Grouping63 Questions
Exam 3: Summarizing Data: Measures of Location57 Questions
Exam 4: Summarizing Data: Measures of Variation56 Questions
Exam 5: Possibilities and Probabilities63 Questions
Exam 6: Some Rules of Probability75 Questions
Exam 7: Expectations and Decisions49 Questions
Exam 8: Probability Distributions78 Questions
Exam 9: The Normal Distribution89 Questions
Exam 10: Sampling and Sampling Distributions61 Questions
Exam 11: Problems of Estimation13 Questions
Exam 12: Tests of Hypotheses: Means55 Questions
Exam 13: Tests of Hypotheses: Standard Deviations39 Questions
Exam 14: Tests of Hypotheses Based on Count Data43 Questions
Exam 15: Analysis of Variance49 Questions
Exam 16: Regression39 Questions
Exam 17: Correlation28 Questions
Exam 18: Nonparametric Tests41 Questions
Select questions type
The measure of variation that is most affected by outliers is the:
Free
(Multiple Choice)
4.9/5  (39)
(39)
Correct Answer: Verified
A
The number of sales of homes having two bedrooms or less in a state for a ten-week period in 1987 is given in the following table:
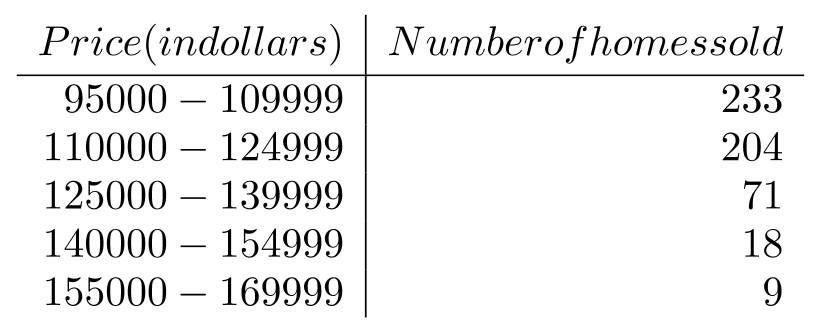 -For a two-bedroom or less home in this state during the given period, find the variance of the prices.
Free
(Short Answer)
4.8/5 (47)
Correct Answer:Verified
The mean, median, and standard deviation of a list of numbers are 128, 160, and 8.2. Suppose that the number 25 is added to each number in the list.
-What is the new value of the median?
Free
(Short Answer)
4.8/5 (35)
Correct Answer:Verified
The number of sales of homes having two bedrooms or less in a state for a ten-week period in 1987 is given in the following table:
-For a two-bedroom or less home in this state during the given period, find the standard deviation of the price.
(Short Answer)
4.8/5 (34)
The following is a list of the number of dollars a sample of students say they are willing to spend for a present for a close friend.
Males:
Females:
-Find the interquartile range for the males.
(Short Answer)
4.8/5 (31)
The following is a list of the number of dollars a sample of students say they are willing to spend for a present for a close friend.
Males:
Females:
-Find the range for the entire group.
(Short Answer)
4.8/5 (48)
Which of the following does not provide an application of the standard deviation?
(Multiple Choice)
5.0/5 (33)
Table 2
Two companies have the following sales results for a particular month.
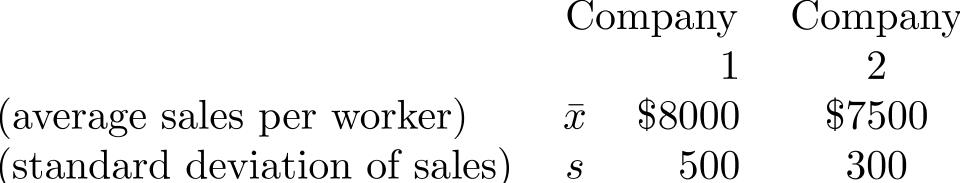 -Use the data in Table 2 to solve the following:
In company 1 , between what values does at least of the salespersons' sales fall?
-Use the data in Table 2 to solve the following:
In company 1 , between what values does at least of the salespersons' sales fall?
(Essay)
4.7/5 (30)
An outlier is an extreme value in the data that may be due to an error in measurement.
(True/False)
4.9/5 (36)
Table 2
Two companies have the following sales results for a particular month.
-Use the data in Table 2 to solve the following:
A salesperson with of sales has lower sales relative to the mean in which of the two companies?
(Essay)
4.8/5 (31)
How does the interquartile range compare to the range when the distribution is shaped like a U?
(Short Answer)
4.8/5 (39)
Distributions having a tail to the right are called negative skewed.
(True/False)
4.9/5 (34)
If a distribution has the general shape of the cross section of a bell, then the _______ allows for a stronger statement than Chebyshev's theorem.
(Short Answer)
4.8/5 (38)
At the start of the program, ten dieters entering a weight-loss program have the weights (in pounds) shown below.
-For this data, find the hinges.
(Essay)
4.9/5 (36)
Table 2
Two companies have the following sales results for a particular month.
-Use the data in Table 2 to solve the following:
In company 1 , at least what percentage of salespersons have sales between and ?
(Essay)
4.8/5 (29)
A set of data has a mean of 80 and a standard deviation of 5 . To determine two values that contain at least of the data, we use:
(Multiple Choice)
4.8/5 (30)
At the start of the program, ten dieters entering a weight-loss program have the weights (in pounds) shown below.
-For this data, using the hinges as quartiles, find the interquartile range.
(Essay)
4.9/5 (34)
The number of standard deviations a value lies above or below the mean is given by a _______.
(Short Answer)
4.8/5 (30)
Which of the following symbols represents a sample value, not a population value?
(Multiple Choice)
4.8/5 (38)
When drawing a boxplot, we usually omit _______ from the data.
(Short Answer)
4.7/5 (32)
Filters
- Essay(0)
- Multiple Choice(0)
- Short Answer(0)
- True False(0)
- Matching(0)