Exam 16: Regression
Exam 1: Introduction37 Questions
Exam 2: Summarizing Data: Listing and Grouping63 Questions
Exam 3: Summarizing Data: Measures of Location57 Questions
Exam 4: Summarizing Data: Measures of Variation56 Questions
Exam 5: Possibilities and Probabilities63 Questions
Exam 6: Some Rules of Probability75 Questions
Exam 7: Expectations and Decisions49 Questions
Exam 8: Probability Distributions78 Questions
Exam 9: The Normal Distribution89 Questions
Exam 10: Sampling and Sampling Distributions61 Questions
Exam 11: Problems of Estimation13 Questions
Exam 12: Tests of Hypotheses: Means55 Questions
Exam 13: Tests of Hypotheses: Standard Deviations39 Questions
Exam 14: Tests of Hypotheses Based on Count Data43 Questions
Exam 15: Analysis of Variance49 Questions
Exam 16: Regression39 Questions
Exam 17: Correlation28 Questions
Exam 18: Nonparametric Tests41 Questions
Select questions type
In linear regression analysis, we assume that for each value of the variable to be predicted has a mean of __________.
Free
(Short Answer)
4.9/5  (37)
(37)
Correct Answer: Verified
The following data gives the demand of a product (in hundreds of units) for five different price levels (in dollars):
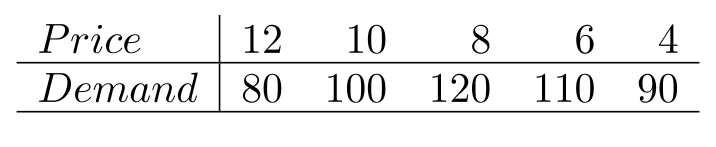 Fit a parabola to this data.
Free
(Short Answer)
5.0/5 (34)
Correct Answer:Verified
The symbol used to indicate the values of points on a least-squares line is
Free
(Multiple Choice)
4.9/5 (32)
Correct Answer:Verified
C
In general, the smaller the standard error of estimate the better the least-squares regression line.
(True/False)
4.8/5 (32)
The term which measures the dispersion of the values about the estimated least-squares line is called __________.
(Short Answer)
4.7/5 (32)
If we are testing the hypothesis that against the alternative that when there are 12 data points and , the correct value to be used is
(Multiple Choice)
4.8/5 (31)
Using a 95% confidence level, construct an interval estimate of the mean consumer awareness of a single product, assuming is spent for its promotion.
(Short Answer)
4.9/5 (33)
Table 16.1
The table below shows annual profit figures (in thousands of dollars) for a company.
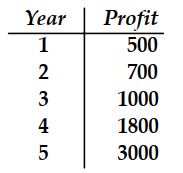 -Fit an exponential trend to the data in Table 16.1.
(Short Answer)
4.7/5 (39)
A multiple regression equation with three independent variables has the form __________.
(Short Answer)
4.8/5 (34)
If paired data plotted on log-log paper fall close to a straight line, we would expect a parabola to provide a good fit for the data.
(True/False)
4.7/5 (38)
In regression analysis, the quantity that gives the amount by which changes for a unit change in is called the
(Multiple Choice)
4.8/5 (33)
When we make inferences about the regression coefficients and , the number of degrees of freedom that is required to use the table is __________.
(Short Answer)
4.8/5 (36)
Table 16.3
A study is supposed to examine the relationship between the amount spent on advertising a new product and consumer awareness of the product ( ) based on the proportion of people who have heard of it. Suppose a sample shows the data below for four different products.
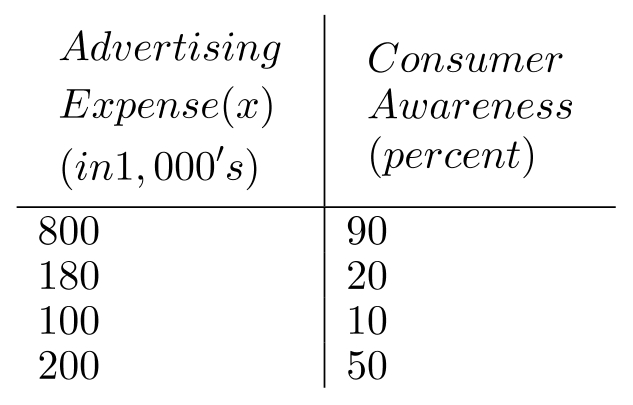 -Use the data in Table 16.3 to solve the following:
a. Find the equation of the least-squares line that will allow us to predict consumer awareness from the advertising expense.
b. Calculate the standard error of estimate.
c. Can the equation found in part (a) be used for an advertising expense of 60 thousand dollars? Why or why not?
-Use the data in Table 16.3 to solve the following:
a. Find the equation of the least-squares line that will allow us to predict consumer awareness from the advertising expense.
b. Calculate the standard error of estimate.
c. Can the equation found in part (a) be used for an advertising expense of 60 thousand dollars? Why or why not?
(Short Answer)
4.9/5 (40)
The estimated regression line is the line that minimizes the sum of the squares of the distances from the given points to the line.
(True/False)
4.9/5 (30)
Given the regression equation , the most central value in a confidence interval for the mean of , given is
(Multiple Choice)
4.8/5 (37)
A personnel manager wants to predict the salary (in thousands of dollars) of a systems analyst based on number of years of experience. A random sample of 12 systems analysts produces the following results:
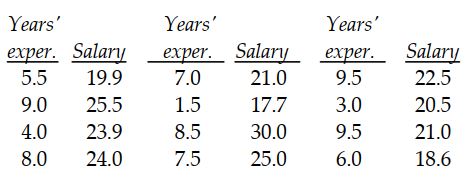 a. Find the least-squares line which predicts salary based on years of experience.
b. Predict the salary of a system analyst with five years experience.
a. Find the least-squares line which predicts salary based on years of experience.
b. Predict the salary of a system analyst with five years experience.
(Short Answer)
4.8/5 (49)
In a two-tailed hypothesis test that , the tabled values are -2.262 and 2.262 . If the obtained value is 1.83 , the null hypothesis __________ rejected.
(Short Answer)
4.8/5 (31)
Using a significance level, test the hypothesis that advertising expenditure has no impact on consumer awareness of a single product, assuming is spent for its promotion.
(Essay)
4.8/5 (40)
Filters
- Essay(0)
- Multiple Choice(0)
- Short Answer(0)
- True False(0)
- Matching(0)