Exam 17: Correlation
Exam 1: Introduction37 Questions
Exam 2: Summarizing Data: Listing and Grouping63 Questions
Exam 3: Summarizing Data: Measures of Location57 Questions
Exam 4: Summarizing Data: Measures of Variation56 Questions
Exam 5: Possibilities and Probabilities63 Questions
Exam 6: Some Rules of Probability75 Questions
Exam 7: Expectations and Decisions49 Questions
Exam 8: Probability Distributions78 Questions
Exam 9: The Normal Distribution89 Questions
Exam 10: Sampling and Sampling Distributions61 Questions
Exam 11: Problems of Estimation13 Questions
Exam 12: Tests of Hypotheses: Means55 Questions
Exam 13: Tests of Hypotheses: Standard Deviations39 Questions
Exam 14: Tests of Hypotheses Based on Count Data43 Questions
Exam 15: Analysis of Variance49 Questions
Exam 16: Regression39 Questions
Exam 17: Correlation28 Questions
Exam 18: Nonparametric Tests41 Questions
Select questions type
In a multiple regression problem, the regression sum of squares is and the total sum of squares is . Find the value of the multiple correlation coefficient.
Free
(Short Answer)
4.8/5  (33)
(33)
Correct Answer: Verified
0.775
Table 17.1
The mathematics S.A.T. scores and college grade point averages of eight students are given below.
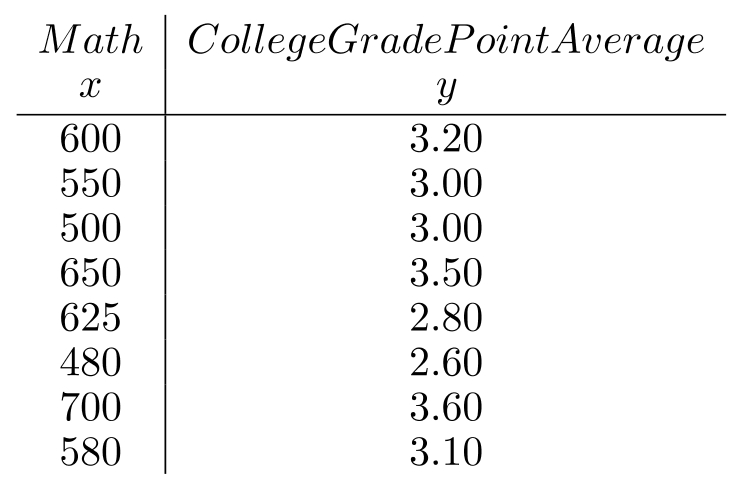 -Use Table 17.1 to solve the following:
a. Calculate the correlation coefficient .
b. What is the proportion of total variation in that is accounted for by ?
c. Test the null hypothesis of no relationship between the two variables at .
d. Calculate a confidence interval for .
-Use Table 17.1 to solve the following:
a. Calculate the correlation coefficient .
b. What is the proportion of total variation in that is accounted for by ?
c. Test the null hypothesis of no relationship between the two variables at .
d. Calculate a confidence interval for .
Free
(Essay)
4.8/5 (31)
Correct Answer:Verified
a. 0.791
b.
c. . Reject the null hypothesis. Conclude that there is a relationship between S.A.T. scores and college grade point averages.
d.
The proportion of total variation which is unexplained can be denoted in symbols by __________.
Free
(Short Answer)
4.7/5 (42)
Correct Answer:Verified
A statistic that measures the relationship between variables while eliminating the effects of other variables is called the
(Multiple Choice)
4.7/5 (35)
If the multiple correlation coefficient is 0.80 , then the proportion of total variation in that can be attributed to the 's is __________.
(Short Answer)
4.9/5 (39)
A financial economist wants to evaluate how interest rates affect the inflation rate. Here are some results on yearly prime interest rates and inflation rates for the 13 years 1965 through 1977. , .
For the situation above:
a. Calculate the sample coefficient of determination and correlation coefficient.
b. Give the proportion of variation explained by the regression line.
c. Test the null hypothesis of no correlation against a two-tailed alternative at the 0.01 significance level.
(Essay)
4.8/5 (33)
For two sets of data and . Suppose each value of is measured in feet. If each value is converted to inches by multiplying by 12, what is the new value of ? Suppose, instead, a constant is added to each value of . What is the new value?
(Short Answer)
4.8/5 (41)
Table 17.3
The table below gives the number of housing starts and the unemployment rates for a sequence of quarters:
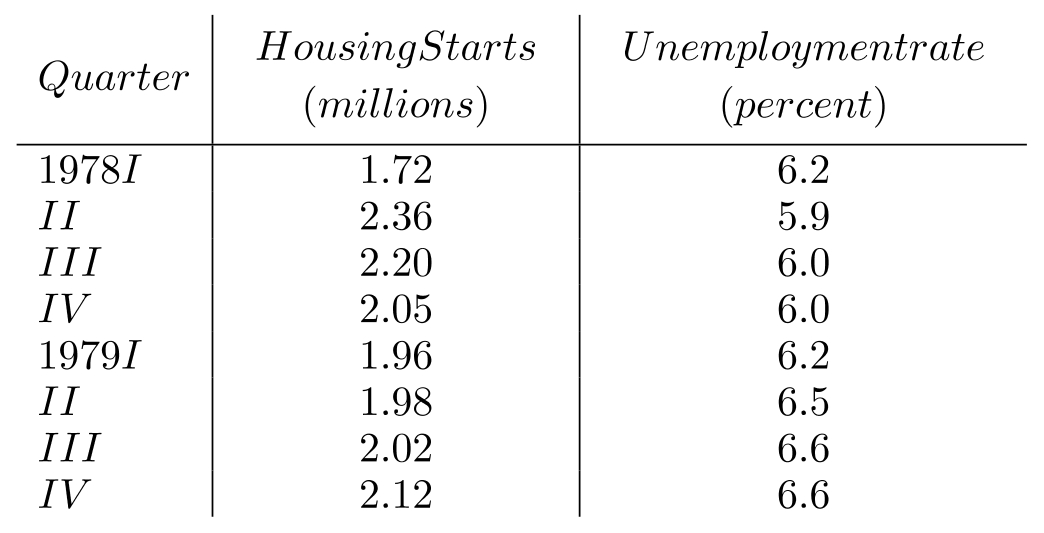 -Use Table 17.3 to solve the following:
a. Calculate the correlation coefficient.
b. What is the proportion of the total variation in unemployment rates that is explained by the number of housing starts?
c. Test the null hypothesis that at .
-Use Table 17.3 to solve the following:
a. Calculate the correlation coefficient.
b. What is the proportion of the total variation in unemployment rates that is explained by the number of housing starts?
c. Test the null hypothesis that at .
(Essay)
4.8/5 (34)
Table 17.2
Below is a list of countries with their 1979 "excess monetary growth*" ( along with their mid -1980 inflation rate).
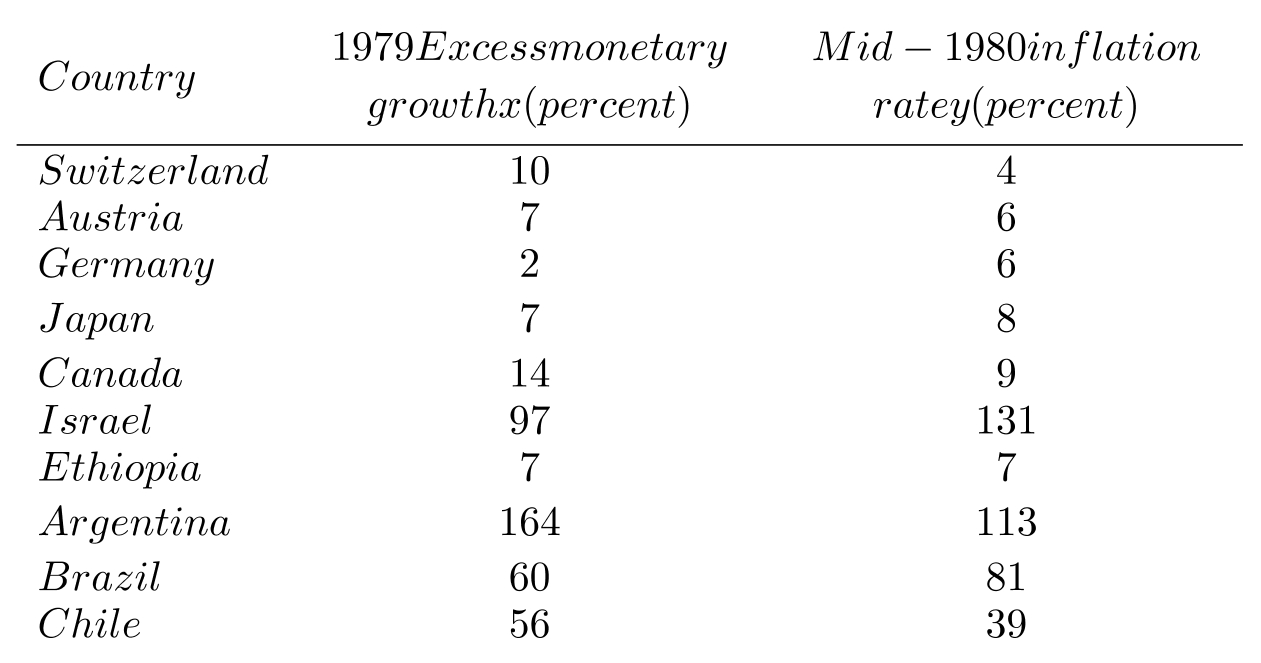 *Excess monetary growth is the extent to which money supply growth exceeds to the growth of constant dollar GNP; specifically, the ratio of 1979 M2 to 1978 M2 is divided by the ratio of 1979 real GNP to 1978 real GNP.
-Use Table 17.2 to solve the following:
a. Calculate the correlation coefficient.
b. What is the proportion of the total variation in inflation rate that is explained by excess monetary growth?
c. Test the null hypothesis that at .
d. Calculate a confidence interval for .
*Excess monetary growth is the extent to which money supply growth exceeds to the growth of constant dollar GNP; specifically, the ratio of 1979 M2 to 1978 M2 is divided by the ratio of 1979 real GNP to 1978 real GNP.
-Use Table 17.2 to solve the following:
a. Calculate the correlation coefficient.
b. What is the proportion of the total variation in inflation rate that is explained by excess monetary growth?
c. Test the null hypothesis that at .
d. Calculate a confidence interval for .
(Essay)
4.8/5 (30)
If all data points lie on the regression line, then the standard error of estimate is __________.
(Short Answer)
4.8/5 (37)
In regression analysis, the quantity that gives the amount by which changes for a unit change in is called the
(Multiple Choice)
4.8/5 (31)
If has a value of 0.60 , then of the variation in can be explained by the variation in .
(True/False)
4.8/5 (37)
If all data points lie on a regression line having a nonzero slope, then equals __________.
(Short Answer)
4.8/5 (27)
If the correlation between and is not zero, then the variability about the estimated regression line will be less than the total variability in .
(True/False)
4.8/5 (37)
The least squares equation is considered to be a better predictor of than the least squares equation , if the multiple correlation coefficient is __________ than the absolute value of the correlation coefficient involving and .
(Short Answer)
4.9/5 (29)
Filters
- Essay(0)
- Multiple Choice(0)
- Short Answer(0)
- True False(0)
- Matching(0)