Exam 2: Summarizing Data: Listing and Grouping
Exam 1: Introduction37 Questions
Exam 2: Summarizing Data: Listing and Grouping63 Questions
Exam 3: Summarizing Data: Measures of Location57 Questions
Exam 4: Summarizing Data: Measures of Variation56 Questions
Exam 5: Possibilities and Probabilities63 Questions
Exam 6: Some Rules of Probability75 Questions
Exam 7: Expectations and Decisions49 Questions
Exam 8: Probability Distributions78 Questions
Exam 9: The Normal Distribution89 Questions
Exam 10: Sampling and Sampling Distributions61 Questions
Exam 11: Problems of Estimation13 Questions
Exam 12: Tests of Hypotheses: Means55 Questions
Exam 13: Tests of Hypotheses: Standard Deviations39 Questions
Exam 14: Tests of Hypotheses Based on Count Data43 Questions
Exam 15: Analysis of Variance49 Questions
Exam 16: Regression39 Questions
Exam 17: Correlation28 Questions
Exam 18: Nonparametric Tests41 Questions
Select questions type
In a stem-and-leaf display, each digit to the right of the vertical line is called a _______.
Free
(Short Answer)
4.9/5  (37)
(37)
Correct Answer: Verified
leaf
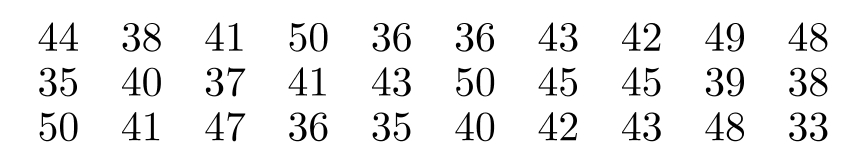
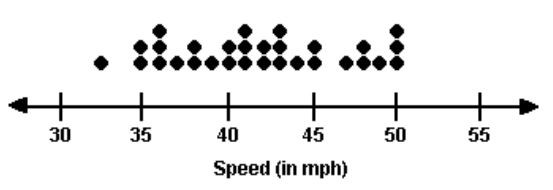
The Highway Patrol, using radar, checked the speeds (in ) of 30 passing motorists at a checkpoint. The results are listed below. Construct a dot diagram for the data.
Free
(Essay)
5.0/5 (33)
Correct Answer:Verified
A class mark is defined as the average of _______
Free
(Short Answer)
4.9/5 (39)
Correct Answer:Verified
the lower and upper class limits
The following are three daily pizza sales in units for a local pizza restaurant for the past two weeks:
-For this data, construct a stem-and-leaf display with the stem labels 1, 2, and 3 (and, hence, with two-digit leaves).
(Essay)
4.8/5 (37)
In a cumulative "less than" distribution, the classes are labeled using
(Multiple Choice)
4.8/5 (38)
A numerical distribution is the same as a _______ distribution.
(Short Answer)
4.9/5 (43)
The heights (in inches) of 30 adult males are listed below. Construct a Pareto diagram in the form of a bar chart for the data. (Remember, in a Pareto diagram, the data is arranged in descending order.)
70 72 71 70 69 73 69 68 70 71
67 71 70 74 69 68 71 71 71 72
69 71 68 67 73 74 70 71 69 68
(Essay)
4.8/5 (38)
A study was conducted to determine how people get jobs. Four hundred subjects were randomly selected and the results are listed below.
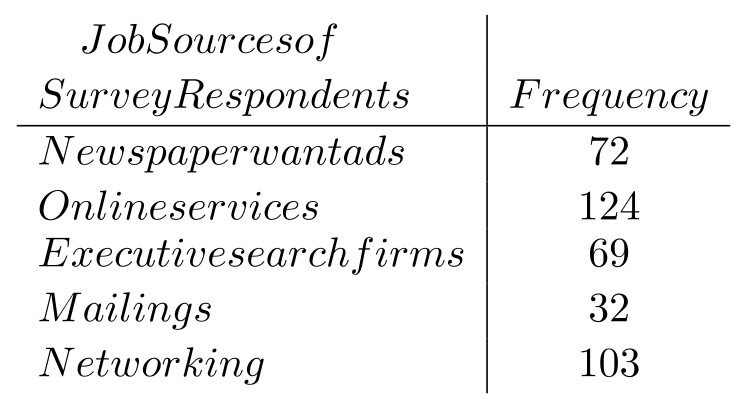 Construct a pie chart of the data.
(Essay)
4.9/5 (35)
Table 1
A sample of 80 company employees is grouped into a table based on their weekly salaries:
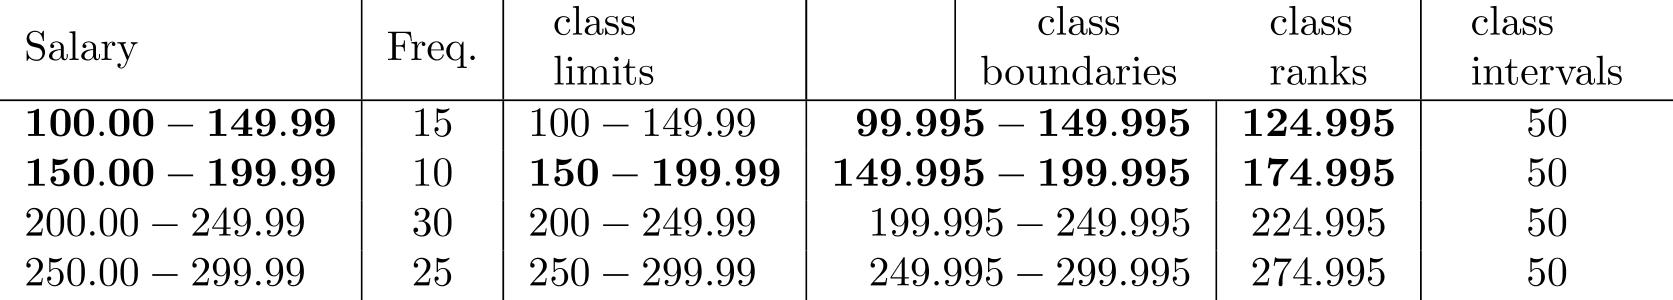 -From the data in Table 1, construct a cumulative "or less" distribution.
(Essay)
5.0/5 (34)
For a frequency distribution, we can never find the total of all the original scores.
(True/False)
4.8/5 (30)
A stem-and-leaf display contains no more information than a frequency distribution.
(True/False)
4.8/5 (31)
A sample of 18 tries to connect to an online service using a phone line.
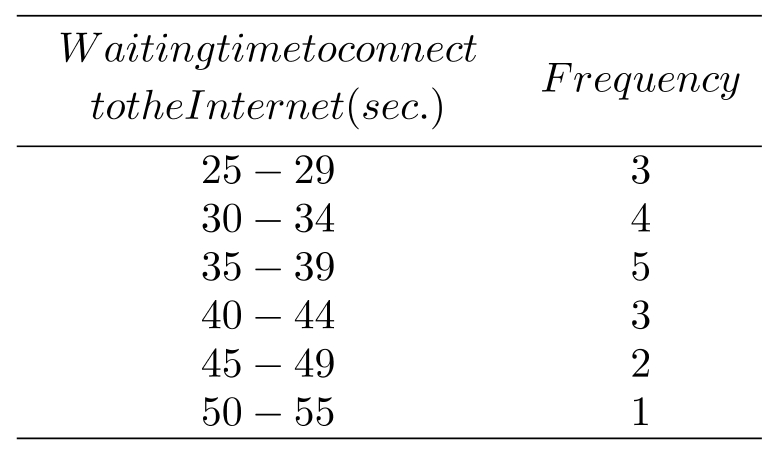 -The numbers 27 and 47 are examples of
(Multiple Choice)
4.7/5 (28)
A study was conducted to determine how people get jobs. Four hundred subjects were randomly selected and the results are listed below.
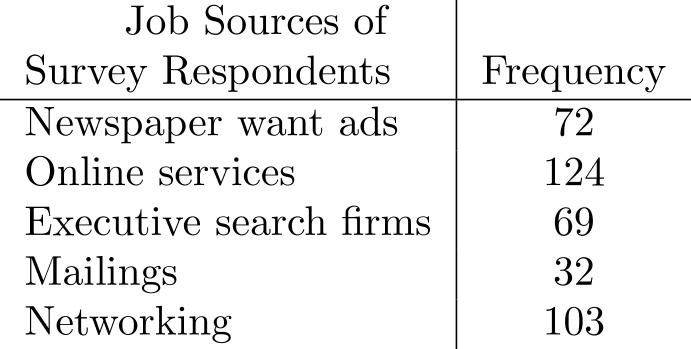 Construct a Pareto diagram in the form of a bar chart for the data. (Remember, in a Pareto diagram, the data is arranged in descending order.)
(Essay)
4.9/5 (43)
The Highway Patrol, using radar, checked the speeds (in mph) of 30 passing motorists at a checkpoint. The results are listed below. Construct an ogive using six classes.

(Essay)
4.9/5 (31)
If categories of a distribution differ in kind rather than degree, the resulting table is called a _______.
(Short Answer)
4.8/5 (32)
In a study of the growth of termite hills in the desert, an experiment was performed to determine how well the height of such hills can be determined from aerial photographs. Following are the heights of 36 termite hills (in centimeters) estimated from aerial photographs, , and measured on the ground, :
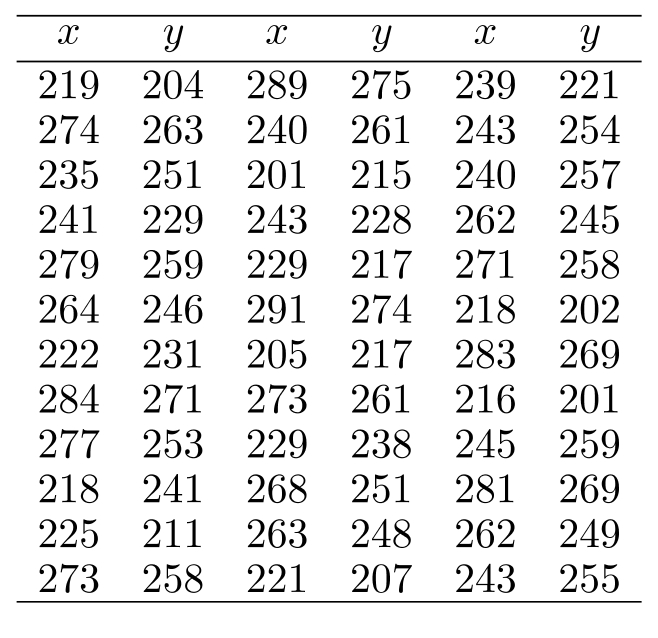 Produce a two-way frequency distribution with the classes 200-219, 220-239, 240-259, 260-279, and 280-299 for both variables.
(Essay)
4.7/5 (24)
In a cumulative "more than" distribution, the classes are labeled using
(Multiple Choice)
4.9/5 (39)
Filters
- Essay(0)
- Multiple Choice(0)
- Short Answer(0)
- True False(0)
- Matching(0)