Exam 10: T Test for Correlated Groups Samples
Exam 1: Science and Statistics17 Questions
Exam 2: Organizing Data, Variables and Measurement13 Questions
Exam 3: Measures of Central Tendency16 Questions
Exam 4: Measures of Variation23 Questions
Exam 5: Standard Scores Z Scores12 Questions
Exam 6: Probability, Hypothesis Testing and Inferential Statistics12 Questions
Exam 7: The Single-Sample Z Test10 Questions
Exam 8: The Single-Sample T Test15 Questions
Exam 9: The T Test for Independent Groups Samples32 Questions
Exam 10: T Test for Correlated Groups Samples18 Questions
Exam 11: Comparing More Than Two Groups19 Questions
Exam 12: One-Way Between-Subjects Analysis of Variance Anova21 Questions
Exam 13: One-Way Repeated Measures Anova16 Questions
Exam 14: Using Designs With More Than One Independent Variable and Two-Way Between-Subjects Anova13 Questions
Exam 15: Correlational Research and Correlation Coefficients22 Questions
Exam 16: Advanced Correlational Techniques: Regression Analysis9 Questions
Exam 17: Chi-Square Tests21 Questions
Exam 18: Tests for Ordinal Data19 Questions
Select questions type
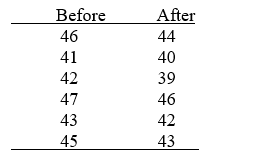
A researcher believes exercise reduces anxiety in women. She identifies a group of women who had not exercised before but are now planning to begin exercising. She gives them a 50-item anxiety inventory before they begin exercising and administers it again after six months of exercising. The anxiety inventory is measured on an interval scale and higher numbers indicate higher anxiety. In addition, scores on the inventory are normally distributed. The scores are given below.
 -Should H0 be rejected? What should the researcher conclude?
Free
(Short Answer)
4.8/5  (26)
(26)
Correct Answer: Verified
Yes, H0 should be rejected. The researcher should conclude that exercise reduces anxiety significantly.
A researcher believes exercise reduces anxiety in women. She identifies a group of women who had not exercised before but are now planning to begin exercising. She gives them a 50-item anxiety inventory before they begin exercising and administers it again after six months of exercising. The anxiety inventory is measured on an interval scale and higher numbers indicate higher anxiety. In addition, scores on the inventory are normally distributed. The scores are given below.
-Calculate the 95% CI.
Free
(Short Answer)
4.8/5 (36)
Correct Answer:Verified
The 95% CI is .81 to -.252
A researcher believes exercise reduces anxiety in women. She identifies a group of women who had not exercised before but are now planning to begin exercising. She gives them a 50-item anxiety inventory before they begin exercising and administers it again after six months of exercising. The anxiety inventory is measured on an interval scale and higher numbers indicate higher anxiety. In addition, scores on the inventory are normally distributed. The scores are given below.
-If significant, compute the effect size and interpret this.
Free
(Short Answer)
4.8/5 (39)
Correct Answer:Verified
Cohen's d is 2.03-a very large effect size. We could use r,2 which is .83, also indicating a very large effect size.
If the null hypothesis is not supported, then the t test should be:
(Multiple Choice)
4.8/5 (36)
A researcher believes exercise reduces anxiety in women. She identifies a group of women who had not exercised before but are now planning to begin exercising. She gives them a 50-item anxiety inventory before they begin exercising and administers it again after six months of exercising. The anxiety inventory is measured on an interval scale and higher numbers indicate higher anxiety. In addition, scores on the inventory are normally distributed. The scores are given below.
-Identify H0 and Ha for this study.
(Short Answer)
4.7/5 (45)
A researcher believes exercise reduces anxiety in women. She identifies a group of women who had not exercised before but are now planning to begin exercising. She gives them a 50-item anxiety inventory before they begin exercising and administers it again after six months of exercising. The anxiety inventory is measured on an interval scale and higher numbers indicate higher anxiety. In addition, scores on the inventory are normally distributed. The scores are given below.
-If significant, draw a graph representing the data.
(Short Answer)
4.7/5 (30)
If a researcher reported for a correlated-groups t test that t(22) = 2.69, p < .01, how many subjects were there in the study?
(Multiple Choice)
4.9/5 (39)
A researcher believes exercise reduces anxiety in women. She identifies a group of women who had not exercised before but are now planning to begin exercising. She gives them a 50-item anxiety inventory before they begin exercising and administers it again after six months of exercising. The anxiety inventory is measured on an interval scale and higher numbers indicate higher anxiety. In addition, scores on the inventory are normally distributed. The scores are given below.
-Conduct the appropriate analysis.
(Short Answer)
4.8/5 (31)
If a researcher reported for a correlated-groups t test that t(18) = 2.90, p < .01, how many subjects were there in the study?
(Multiple Choice)
4.8/5 (35)
If a correlated-groups t test and an independent-groups t test both have df = 16, which experiment used more subjects?
(Multiple Choice)
4.9/5 (35)
If a researcher reported for a correlated-groups t test that t(12) = 3.66, p < .01, how many subjects were there in the study?
(Multiple Choice)
4.9/5 (39)
Imagine that you conducted a correlated-groups t test with 7 subjects. For a two-tailed test, the tcv at = .05 would be:
(Multiple Choice)
4.7/5 (34)
In the formula to compute the correlated-groups t test, the denominator in the equation represents:
(Multiple Choice)
4.8/5 (44)
If a correlated-groups t test and an independent-groups t test both have df = 16, how many subjects were in each study?
(Multiple Choice)
4.9/5 (32)
A researcher believes exercise reduces anxiety in women. She identifies a group of women who had not exercised before but are now planning to begin exercising. She gives them a 50-item anxiety inventory before they begin exercising and administers it again after six months of exercising. The anxiety inventory is measured on an interval scale and higher numbers indicate higher anxiety. In addition, scores on the inventory are normally distributed. The scores are given below.
-What statistical test should be used to analyze these data?
(Short Answer)
4.8/5 (39)
After calculating a correlated-groups t test, if you find that it is equal to zero, then:
(Multiple Choice)
4.8/5 (33)
If the null hypothesis is true, then the t test should be close to:
(Multiple Choice)
4.8/5 (34)
Filters
- Essay(0)
- Multiple Choice(0)
- Short Answer(0)
- True False(0)
- Matching(0)