Exam 9: The T Test for Independent Groups Samples
Exam 1: Science and Statistics17 Questions
Exam 2: Organizing Data, Variables and Measurement13 Questions
Exam 3: Measures of Central Tendency16 Questions
Exam 4: Measures of Variation23 Questions
Exam 5: Standard Scores Z Scores12 Questions
Exam 6: Probability, Hypothesis Testing and Inferential Statistics12 Questions
Exam 7: The Single-Sample Z Test10 Questions
Exam 8: The Single-Sample T Test15 Questions
Exam 9: The T Test for Independent Groups Samples32 Questions
Exam 10: T Test for Correlated Groups Samples18 Questions
Exam 11: Comparing More Than Two Groups19 Questions
Exam 12: One-Way Between-Subjects Analysis of Variance Anova21 Questions
Exam 13: One-Way Repeated Measures Anova16 Questions
Exam 14: Using Designs With More Than One Independent Variable and Two-Way Between-Subjects Anova13 Questions
Exam 15: Correlational Research and Correlation Coefficients22 Questions
Exam 16: Advanced Correlational Techniques: Regression Analysis9 Questions
Exam 17: Chi-Square Tests21 Questions
Exam 18: Tests for Ordinal Data19 Questions
Select questions type
t(14) = 3.35, one-tailed. Based on these results, we _____.
Free
(Multiple Choice)
4.9/5  (35)
(35)
Correct Answer: Verified
A
Imagine that you conducted an independent-groups t test with 7 subjects in each group. For a two-tailed test, the tcv at = .05 would be:
Free
(Multiple Choice)
4.7/5 (41)
Correct Answer:Verified
D
The null hypothesis for a one-tailed independent-groups t test states that:
Free
(Multiple Choice)
4.9/5 (29)
Correct Answer:Verified
A
In the formula for an independent-groups t test, the denominator in the equation represents:
(Multiple Choice)
4.9/5 (31)
A college student is interested in whether there is a difference between male and female students in the amount of time spent working out each week. The student gathers information from a random sample of male and female students on campus. The amount of time spent working out is normally distributed. The data are given below.
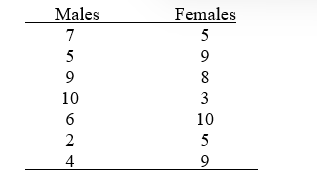 -Should H0 be rejected? What should the researcher conclude?
(Short Answer)
5.0/5 (46)
The alternative hypothesis for a one-tailed independent-groups t test states that:
(Multiple Choice)
4.8/5 (29)
A student is interested in whether students who study with others devote as much attention to their studies as do students who study alone. He believes those who study alone devote more attention to their studies. He randomly assigns subjects to either group or individual study conditions and has them read and study the same passage of information for the same amount of time. Subjects are then all given the same 10-item test on the material. Their scores appear below. Scores on the test represent interval/ratio data and are normally distributed.
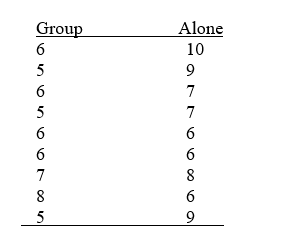 -What statistical test should be used to analyze these data?
(Essay)
4.9/5 (31)
If an independent-groups t test has 13 subjects in each group, then the degrees of freedom are:
(Multiple Choice)
4.8/5 (39)
A college student is interested in whether there is a difference between male and female students in the amount of time spent working out each week. The student gathers information from a random sample of male and female students on campus. The amount of time spent working out is normally distributed. The data are given below.
-If significant, draw a graph representing the data.
(Short Answer)
4.9/5 (35)
A student is interested in whether students who study with others devote as much attention to their studies as do students who study alone. He believes those who study alone devote more attention to their studies. He randomly assigns subjects to either group or individual study conditions and has them read and study the same passage of information for the same amount of time. Subjects are then all given the same 10-item test on the material. Their scores appear below. Scores on the test represent interval/ratio data and are normally distributed.
-Identify H0 and Ha for this study.
(Essay)
4.7/5 (29)
If the null hypothesis is not supported, then the t test should be:
(Multiple Choice)
4.8/5 (36)
If a researcher reported for an independent-groups t test that t(12) = 3.66, p < .01, how many subjects were there in the study?
(Multiple Choice)
4.7/5 (20)
A college student is interested in whether there is a difference between male and female students in the amount of time spent working out each week. The student gathers information from a random sample of male and female students on campus. The amount of time spent working out is normally distributed. The data are given below.
-If significant, compute the effect size and interpret this.
(Short Answer)
4.9/5 (29)
A student is interested in whether students who study with others devote as much attention to their studies as do students who study alone. He believes those who study alone devote more attention to their studies. He randomly assigns subjects to either group or individual study conditions and has them read and study the same passage of information for the same amount of time. Subjects are then all given the same 10-item test on the material. Their scores appear below. Scores on the test represent interval/ratio data and are normally distributed.
-If significant, draw a graph representing the data.
(Essay)
4.7/5 (27)
If a researcher reported for an independent-groups t test that t(22) = 2.69, p < .01, how many subjects were there in the study?
(Multiple Choice)
4.8/5 (37)
According to some research, males have better spatial skills than do females; and according to other research, females have better reading skills than males. A student is interested in determining which gender performs better on a word-search puzzle (a puzzle in which words are hidden vertically, horizontally, and diagonally within an array of letters) since this type of puzzle involves both spatial and reading skills. A sample of males and females volunteers to participate. They are given 10 minutes to work on a 50-word puzzle. The number of words correctly recognized is recorded for each subject, and the resulting data are as follows:
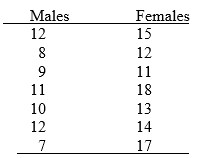 Conduct the appropriate analysis of these data, and determine whether there are any significant differences.
(Essay)
4.9/5 (34)
For an independent-groups t test, effect size can be measured using:
(Multiple Choice)
4.9/5 (35)
A student is interested in whether students who study with others devote as much attention to their studies as do students who study alone. He believes those who study alone devote more attention to their studies. He randomly assigns subjects to either group or individual study conditions and has them read and study the same passage of information for the same amount of time. Subjects are then all given the same 10-item test on the material. Their scores appear below. Scores on the test represent interval/ratio data and are normally distributed.
-If significant, compute the effect size and interpret this.
(Essay)
4.8/5 (40)
A student is interested in whether students who study with others devote as much attention to their studies as do students who study alone. He believes those who study alone devote more attention to their studies. He randomly assigns subjects to either group or individual study conditions and has them read and study the same passage of information for the same amount of time. Subjects are then all given the same 10-item test on the material. Their scores appear below. Scores on the test represent interval/ratio data and are normally distributed.
-Conduct the appropriate analysis.
(Essay)
4.9/5 (39)
Filters
- Essay(0)
- Multiple Choice(0)
- Short Answer(0)
- True False(0)
- Matching(0)