Exam 10: Multiple Regression
Exam 1: Collecting Data68 Questions
Exam 2: Describing Data125 Questions
Exam 3: Confidence Intervals148 Questions
Exam 4: Hypothesis Tests119 Questions
Exam 5: Approximating With a Distribution74 Questions
Exam 6: Inference for Means and Proportions166 Questions
Exam 7: Chi-Square Tests for Categorical Variables47 Questions
Exam 8: Anova to Compare Means52 Questions
Exam 9: Inference for Regression123 Questions
Exam 10: Multiple Regression72 Questions
Exam 11: Probability Basics165 Questions
Select questions type
Use the following to answer questions :
A quantitatively savvy, young couple is interested in purchasing a home in northern New York. They collected data on houses that had recently sold in the two towns they are considering. The variables they collected are the selling price of the home (in thousands of dollars), the size of the home (in square feet), the age of the home (in years), and the town in which the house is located (coded 1 = Canton and 0 = Potsdam). Output from their multiple regression analysis is provided.
The regression equation is
Price (in thousands) = 69.2 + 0.0627 Size (sq. ft.) - 0.632 Age + 1.6 Town
 S = 40.0763 R-Sq = 59.3% R-Sq(adj) = 56.5%
Analysis of Variance
S = 40.0763 R-Sq = 59.3% R-Sq(adj) = 56.5%
Analysis of Variance
 -One of the houses they are considering is a 62 year old, 1,865 square foot house in Potsdam. What is the predicted selling price of this house? Round to three decimal places.
(Essay)
4.8/5  (38)
(38)
Use the following
The ANOVA table from a multiple regression analysis is provided.
 -How large is the sample size?
(Short Answer)
4.7/5 (34)
Use the following
Does the price of used cars depend upon the model? Data were collected on the selling price and age of used Hyundai Elantras (coded as Model = 1) and Toyota Camrys (coded as Model = 0). Output from the multiple regression analysis is provided.
The regression equation is Price = 14.5 - 0.619 Age - 3.63 Model
 S = 2.63465 R-Sq = 69.3% R-Sq(adj) = 68.4%
Analysis of Variance
S = 2.63465 R-Sq = 69.3% R-Sq(adj) = 68.4%
Analysis of Variance
 -What is the predicted price of a 6-year-old Hyundai Elantra? Round to three decimal places.
(Essay)
4.9/5 (43)
Use the following to answer questions :
Data were collected on the age (in years), mileage (in thousands of miles), and price (in thousands of dollars) of a random sample of used Hyundai Elantras. Output from two models are provided.
Single Predictor Model:
The regression equation is Price = 13.8 - 0.0912 Mileage
 Two Predictor Model:
The regression equation is Price = 15.2 - 0.0101 Mileage - 1.55 Age
Two Predictor Model:
The regression equation is Price = 15.2 - 0.0101 Mileage - 1.55 Age
 S = 1.39445 R-Sq = 89.0% R-Sq(adj) = 88.0%
Analysis of Variance
S = 1.39445 R-Sq = 89.0% R-Sq(adj) = 88.0%
Analysis of Variance
 -Use the provided output to determine how many cars were in the sample.
(Multiple Choice)
4.8/5 (40)
Use the following
While many people count calories, some often don't think about calories in the beverages they consume. Starbucks, one of the leading coffeehouse chains, provides nutrition information about all of their beverages on their website. Nutrition information, including number of calories, fat (g), carbohydrates (g), and protein (g), was collected on a random sample of Starbucks' 16 ounce ("Grande") hot espresso drinks. Note that all of the drinks in the sample are made with 2% milk unless the name specifically included the term "Skinny,"
which is how Starbucks indicated a beverage made with nonfat milk.
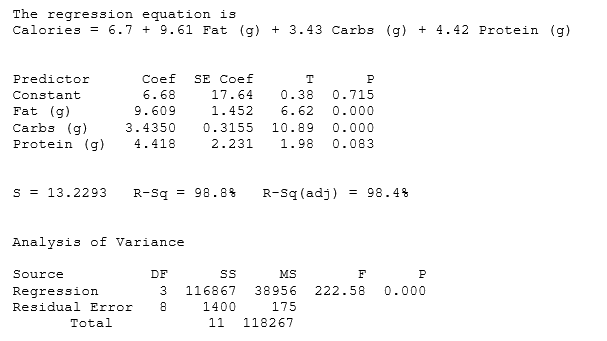 -Which predictors are significant at the 5% level? What are their p-values?
(Essay)
4.8/5 (47)
Use the following to answer questions :
A quantitatively savvy, young couple is interested in purchasing a home in northern New York. They collected data on houses that had recently sold in the two towns they are considering. The variables they collected are the selling price of the home (in thousands of dollars), the size of the home (in square feet), the age of the home (in years), and the town in which the house is located (coded 1 = Canton and 0 = Potsdam). Output from their multiple regression analysis is provided.
The regression equation is
Price (in thousands) = 69.2 + 0.0627 Size (sq. ft.) - 0.632 Age + 1.6 Town
S = 40.0763 R-Sq = 59.3% R-Sq(adj) = 56.5%
Analysis of Variance
-How many houses are used in this dataset?
(Multiple Choice)
4.8/5 (36)
Use the following to answer questions :
A quantitatively savvy, young couple is interested in purchasing a home in northern New York. They collected data on houses that had recently sold in the two towns they are considering. The variables they collected are the selling price of the home (in thousands of dollars), the size of the home (in square feet), the age of the home (in years), and the town in which the house is located (coded 1 = Canton and 0 = Potsdam). Output from their multiple regression analysis is provided.
The regression equation is
Price (in thousands) = 69.2 + 0.0627 Size (sq. ft.) - 0.632 Age + 1.6 Town
S = 40.0763 R-Sq = 59.3% R-Sq(adj) = 56.5%
Analysis of Variance
-One of the houses they are considering is a 92 year old, 1,742 square foot house in Canton. What is the predicted selling price of this house? Round to three decimal places.
(Essay)
4.8/5 (32)
Use the following to answer questions :
A quantitatively savvy, young couple is interested in purchasing a home in northern New York. They collected data on houses that had recently sold in the two towns they are considering. The variables they collected are the selling price of the home (in thousands of dollars), the size of the home (in square feet), the age of the home (in years), and the town in which the house is located (coded 1 = Canton and 0 = Potsdam). Output from their multiple regression analysis is provided.
The regression equation is
Price (in thousands) = 69.2 + 0.0627 Size (sq. ft.) - 0.632 Age + 1.6 Town
S = 40.0763 R-Sq = 59.3% R-Sq(adj) = 56.5%
Analysis of Variance
-Interpret the coefficient of Town in context.
(Essay)
4.7/5 (41)
Use the following to answer questions :
Data were collected on the age (in years), mileage (in thousands of miles), and price (in thousands of dollars) of a random sample of used Hyundai Elantras. Output from two models are provided.
Single Predictor Model:
The regression equation is Price = 13.8 - 0.0912 Mileage
Two Predictor Model:
The regression equation is Price = 15.2 - 0.0101 Mileage - 1.55 Age
S = 1.39445 R-Sq = 89.0% R-Sq(adj) = 88.0%
Analysis of Variance
-What is the explanatory variable used in the single predictor model?
(Essay)
4.9/5 (36)
Use the following
Does the price of used cars depend upon the model? Data were collected on the selling price and age of used Hyundai Elantras (coded as Model = 1) and Toyota Camrys (coded as Model = 0). Output from the multiple regression analysis is provided.
The regression equation is Price = 14.5 - 0.619 Age - 3.63 Model
S = 2.63465 R-Sq = 69.3% R-Sq(adj) = 68.4%
Analysis of Variance
-Which predictors are significant at the 5% level? What are their p-values?
(Essay)
4.7/5 (29)
Use the following
In recent years, fast food restaurants have been required to publish nutrition information about the foods they serve. Nutrition information for a random sample of McDonald's lunch/dinner menu items (excluding sides and drinks) was obtained from their website. Output from a multiple regression analysis is provided.
The regression equation is Calories = 65.2 + 9.46 Total Fat (g) + 0.876 Cholesterol (mg) + 0.131 Sodium (mg)
 S = 39.4529 R-Sq = 95.5% R-Sq(adj) = 94.3%
Analysis of Variance
S = 39.4529 R-Sq = 95.5% R-Sq(adj) = 94.3%
Analysis of Variance
 -At the 5% significance level, is the model effective according to the ANOVA test? Include all details of the test.
(Essay)
4.8/5 (39)
Use the following
In recent years, fast food restaurants have been required to publish nutrition information about the foods they serve. Nutrition information for a random sample of McDonald's lunch/dinner menu items (excluding sides and drinks) was obtained from their website. Output from a multiple regression analysis is provided.
The regression equation is Calories = 65.2 + 9.46 Total Fat (g) + 0.876 Cholesterol (mg) + 0.131 Sodium (mg)
S = 39.4529 R-Sq = 95.5% R-Sq(adj) = 94.3%
Analysis of Variance
-Which variable, if any, would you suggest to try eliminating first to possibly improve this model? Describe one way in which you might determine if the model had been improved by removing that variable. Explain briefly.
(Essay)
4.9/5 (43)
Filters
- Essay(0)
- Multiple Choice(0)
- Short Answer(0)
- True False(0)
- Matching(0)