Exam 4: Hypothesis Tests
Exam 1: Collecting Data68 Questions
Exam 2: Describing Data125 Questions
Exam 3: Confidence Intervals148 Questions
Exam 4: Hypothesis Tests119 Questions
Exam 5: Approximating With a Distribution74 Questions
Exam 6: Inference for Means and Proportions166 Questions
Exam 7: Chi-Square Tests for Categorical Variables47 Questions
Exam 8: Anova to Compare Means52 Questions
Exam 9: Inference for Regression123 Questions
Exam 10: Multiple Regression72 Questions
Exam 11: Probability Basics165 Questions
Select questions type
Use the following
A certain species of tree has an average life span of 130 years. A researcher has noticed a large number of trees of this species washing up along a beach as driftwood. She takes core samples from 27 of those trees to count the number of rings and measure the widths of the rings. Counting the rings allows the researcher to determine the age of each tree. Her data are displayed in the provided table. One of her interests is determining if this sample provides evidence that the average age of the driftwood is less than the 130 year life span expected for this type of tree. If the average age is less than 130 years it might suggest that the trees have died from unusual causes, such as invasive beetles or logging.
 -Define the appropriate parameter(s) and state the hypotheses for testing if this sample provides evidence that the average age of the driftwood along this beach is less than 130 years.
Free
(Essay)
4.8/5  (31)
(31)
Correct Answer: Verified
Parameter:  =average age of driftwood trees along this beach
Hypotheses:  versus
Use the following
As of August 8, 2012, the national average price for a gallon of regular unleaded gasoline was $3.63. The prices for a sample of n = 10 gas stations in the state of Illinois are provided.
 It is of interest to use this sample to compare the average gas price in Illinois to the national average.
-Use your p-value to make a decision about these hypotheses. Be sure to word your decision in the context of the problem. Include an assessment of the strength of your evidence.
It is of interest to use this sample to compare the average gas price in Illinois to the national average.
-Use your p-value to make a decision about these hypotheses. Be sure to word your decision in the context of the problem. Include an assessment of the strength of your evidence.
Free
(Essay)
4.9/5 (40)
Correct Answer:Verified
This p-value provides very strong evidence that the average gas price in Illinois is greater than 3.63 (the national average).
Use the following
A Division III college men's basketball team is interested in identifying factors that impact the outcomes of their games. They plan to use "point spread"
(their score minus their opponent's score) to quantify the outcome of each game this season; positive values indicate games that they won while negative values indicate games they lost. They want to determine if "steal differential"
(the number of steals they have in the game minus the number of steals their opponent had) is related to point spread; positive values indicate games where they had more steals than their opponent. The data for the n = 25 games they played this season displayed in the provided table.
 Assuming that this season was a typical season for the team, they want to know if steal differential is positively correlated with point spread.
-Describe how you would generate a single randomization sample in this situation, and identify the statistic you would calculate for each sample.
Assuming that this season was a typical season for the team, they want to know if steal differential is positively correlated with point spread.
-Describe how you would generate a single randomization sample in this situation, and identify the statistic you would calculate for each sample.
Free
(Essay)
4.8/5 (37)
Correct Answer:Verified
The null hypothesis is that the correlation between point spread and steal differential is 0 (  =0). One way to generate a sample that is consistent with this value is to write the 25 steal differentials on index cards, shuffle them, and deal them out (one to each of the observed point spreads). The sample correlation r for the 25 new pairs should be calculated.
Use the following
A Division III college men's basketball team is interested in identifying factors that impact the outcomes of their games. They plan to use "point spread"
(their score minus their opponent's score) to quantify the outcome of each game this season; positive values indicate games that they won while negative values indicate games they lost. They want to determine if "steal differential"
(the number of steals they have in the game minus the number of steals their opponent had) is related to point spread; positive values indicate games where they had more steals than their opponent. The data for the first five games are in the provided table as an example.
 The correlation between point spread and steal differential for the n = 25 games they played this season is about r = 0.35. Assuming that this season was a typical season for the team, they want to test if this sample provides evidence that steal differential is positively correlated with point spread.
-Use your p-value to make a decision about these hypotheses. Be sure to word your decision in the context of the problem.
The correlation between point spread and steal differential for the n = 25 games they played this season is about r = 0.35. Assuming that this season was a typical season for the team, they want to test if this sample provides evidence that steal differential is positively correlated with point spread.
-Use your p-value to make a decision about these hypotheses. Be sure to word your decision in the context of the problem.
(Essay)
4.8/5 (34)
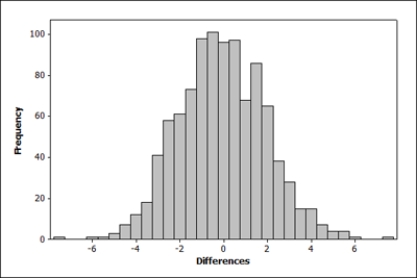
The following figure shows a randomization distribution for the hypotheses  versus
 . The statistic used for each sample is
  . Which of the two possible sample results provides the most evidence against Ho?
(Multiple Choice)
4.9/5 (44)
Use the following
Consider testing the hypotheses Ho: p = 0.4 versus Ha: p > 0.4. Four possible sample statistics, along with four possible p-values, are given. Match the statistics to their p-values.
-________ p-value = 0.019
(Multiple Choice)
4.8/5 (42)
Use the following
The makers of a popular brand of laundry detergent have discovered a new secret ingredient that they believe will boost the cleaning power of their detergent. The new ingredient is expensive, and if they use it, they would have to increase the retail price of the detergent (and they worry that the price increase will cause them to lose customers). However, they believe that if the improved detergent gets clothes drastically cleaner, customers will recognize that it is worth the extra cost. They conduct an experiment to compare the performance of the new and old formulas at removing grass stains, red wine, and chocolate from white t-shirts. Each cleaned shirt was rated on a scale from 1 (stain did not get removed) to 10 (no evidence of the stain) by trained experts. They compared the average rating for the new and old formulas.
-Suppose, at the 5% significance level, they find that the new formula cleaned the shirts significantly better than the old formula, with a p-value of 0.046. Interpret the p-value, in terms of the probability of the results happening by random chance, in this context.
(Essay)
4.9/5 (33)
When generating a randomization sample, the sample should be consistent with the ________________ hypothesis.
(Short Answer)
4.8/5 (31)
Suppose that a 95% confidence interval for  is (54.8, 60.8). Which of the following is most likely the p-value for the test of
  versus ?
 ?
?
(Multiple Choice)
4.8/5 (43)
Use the following
The owner of a small pet supply store wants to open a second store in another city, but he only wants to do so if more than one-third of the city's households have pets (otherwise there won't be enough business). He samples 150 of the households and finds that 64 have pets.
-Use technology to determine if this sample provides evidence that more than one-third of households in this city own pets. Use a 5% significance level.
(Essay)
4.7/5 (41)
Use the following
A Division III college men's basketball team is interested in identifying factors that impact the outcomes of their games. They plan to use "point spread"
(their score minus their opponent's score) to quantify the outcome of each game this season; positive values indicate games that they won while negative values indicate games they lost. They want to determine if "steal differential"
(the number of steals they have in the game minus the number of steals their opponent had) is related to point spread; positive values indicate games where they had more steals than their opponent. The data for the first five games are in the provided table as an example.
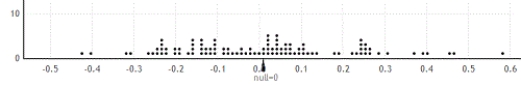
 The correlation between point spread and steal differential for the n = 25 games they played this season is about r = 0.35. Assuming that this season was a typical season for the team, they want to know if steal differential is positively correlated with point spread.
-Use the provided randomization distribution (based on 100 samples) to determine if this sample provides evidence that point spread and steal differential are positively correlated. Use a 10% significance level to make your conclusion.
The correlation between point spread and steal differential for the n = 25 games they played this season is about r = 0.35. Assuming that this season was a typical season for the team, they want to know if steal differential is positively correlated with point spread.
-Use the provided randomization distribution (based on 100 samples) to determine if this sample provides evidence that point spread and steal differential are positively correlated. Use a 10% significance level to make your conclusion.
(Essay)
4.8/5 (39)
Use the following
As of August 8, 2012, the national average price for a gallon of regular unleaded gasoline was $3.63. The prices for a sample of n = 10 gas stations in the state of Illinois are provided.
 It is of interest to use this sample to compare the average gas price in Illinois to the national average.
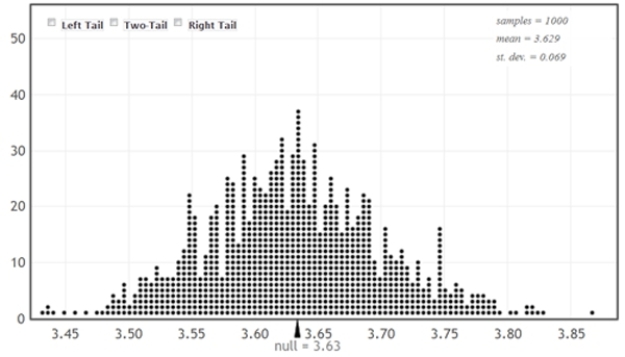
-Use the provided randomization distribution (based on 1,000 samples) to test if this sample provides evidence that the average gas price in Illinois exceeds the national average. Include an assessment of the strength of your evidence.
It is of interest to use this sample to compare the average gas price in Illinois to the national average.
-Use the provided randomization distribution (based on 1,000 samples) to test if this sample provides evidence that the average gas price in Illinois exceeds the national average. Include an assessment of the strength of your evidence.
(Essay)
4.7/5 (42)
Use the following
A certain species of tree has an average life span of 130 years. A researcher has noticed a large number of trees of this species washing up along a beach as driftwood. She takes core samples from 27 of those trees to count the number of rings and measure the widths of the rings. Counting the rings allows the researcher to determine the age of each tree. Her data are displayed in the provided table. One of her interests is determining if this sample provides evidence that the average age of the driftwood is less than the 130 year life span expected for this type of tree. If the average age is less than 130 years it might suggest that the trees have died from unusual causes, such as invasive beetles or logging.
 -Describe how you would generate a single randomization sample in this situation, and identify the statistic you would calculate for each sample.
(Essay)
4.8/5 (41)
Use the following
A Division III college men's basketball team is interested in identifying factors that impact the outcomes of their games. They plan to use "point spread"
(their score minus their opponent's score) to quantify the outcome of each game this season; positive values indicate games that they won while negative values indicate games they lost. They want to determine if "steal differential"
(the number of steals they have in the game minus the number of steals their opponent had) is related to point spread; positive values indicate games where they had more steals than their opponent. The data for the first five games are in the provided table as an example.
The correlation between point spread and steal differential for the n = 25 games they played this season is about r = 0.35. Assuming that this season was a typical season for the team, they want to test if this sample provides evidence that steal differential is positively correlated with point spread.
-Describe how you would generate a single randomization sample in this situation, and identify the statistic you would calculate for each sample.
(Essay)
4.8/5 (44)
Use the following
As of August 8, 2012, the national average price for a gallon of regular unleaded gasoline was $3.63. The prices for a sample of n = 10 gas stations in the state of Illinois are provided.
 It is of interest to use this sample to compare the average gas price in Illinois to the national average.
-Use technology to create a randomization distribution with at least 1,000 values for testing these hypotheses. Use your randomization distribution to estimate the p-value for this sample.
It is of interest to use this sample to compare the average gas price in Illinois to the national average.
-Use technology to create a randomization distribution with at least 1,000 values for testing these hypotheses. Use your randomization distribution to estimate the p-value for this sample.
(Essay)
4.9/5 (37)
Use the following
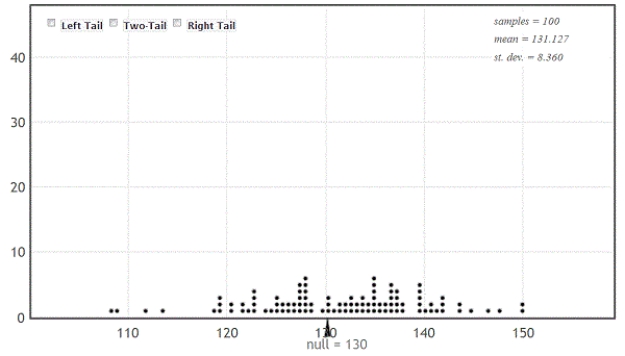
A certain species of tree has an average life span of 130 years. A researcher has noticed a large number of trees of this species washing up along a beach as driftwood. She takes core samples from 27 of those trees to count the number of rings and measure the widths of the rings. Counting the rings allows the researcher to determine the age of each tree. The average age of the trees in the sample is approximately 120 years. One of her interests is determining if this sample provides evidence that the average age of the driftwood is less than the 130 year life span expected for this type of tree. If the average age is less than 130 years it might suggest that the trees have died from unusual causes, such as invasive beetles or logging.
-Use the provided randomization distribution (based on 100 samples) to estimate the p-value for this sample.
(Essay)
4.9/5 (30)
Use the following
In May 2012, President Obama made history by revealing his support of gay marriage. Around that time, the Gallup Organization polled 1,024 U.S. adults about their opinions on gay/lesbian relations and gay marriage. They found that 54% of those sampled viewed gay/lesbian relations as "morally acceptable" and that 50% felt that gay marriage should be legal.
-Define the appropriate parameter and state the hypotheses for testing if this sample provides evidence that the proportion of American adults who support gay marriage differs from 50%.
(Essay)
4.7/5 (41)
Of the two p-values, which provides more evidence against Ho?
(Multiple Choice)
4.9/5 (40)
Use the following
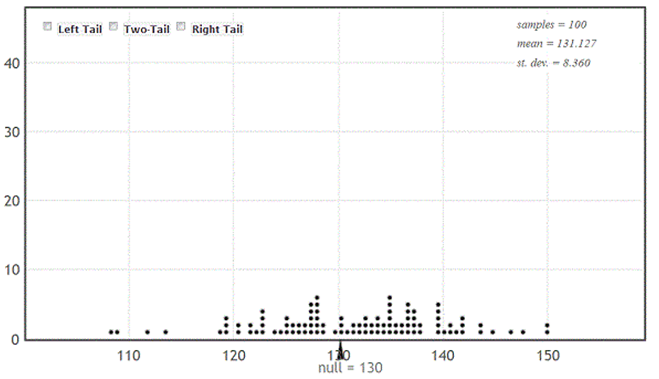
A certain species of tree has an average life span of 130 years. A researcher has noticed a large number of trees of this species washing up along a beach as driftwood. She takes core samples from 27 of those trees to count the number of rings and measure the widths of the rings. Counting the rings allows the researcher to determine the age of each tree. The average age of the trees in the sample is about 120 years. One of her interests is determining if this sample provides evidence that the average age of the driftwood is less than the 130 year life span expected for this type of tree. If the average age is less than 130 years it might suggest that the trees have died from unusual causes, such as invasive beetles or logging.
-Use the provided randomization distribution (based on 100 samples) to determine if this sample provides evidence that the average age of the driftwood along this beach is less than 130 years. Use a 5% significance level to make your conclusion.
(Essay)
4.9/5 (44)
Use the following
The makers of a popular brand of laundry detergent have discovered a new secret ingredient that they believe will boost the cleaning power of their detergent. The new ingredient is expensive, and if they use it, they would have to increase the retail price of the detergent (and they worry that the price increase will cause them to lose customers). However, they believe that if the improved detergent gets clothes drastically cleaner, customers will recognize that it is worth the extra cost. They conduct an experiment to compare the performance of the new and old formulas at removing grass stains, red wine, and chocolate from white t-shirts. Each cleaned shirt was rated on a scale from 1 (stain did not get removed) to 10 (no evidence of the stain) by trained experts. They compared the average rating for the new and old formulas.
-Suppose they find that the average rating for the shirts cleaned with the new formula was 8.2 and the average rating for the shirts cleaned with the old formula is 8.0 (p-value = 0.046). Do you think these results are practically significant? Briefly explain.
(Essay)
4.8/5 (31)
Filters
- Essay(0)
- Multiple Choice(0)
- Short Answer(0)
- True False(0)
- Matching(0)