Exam 9: Inference for Regression
Exam 1: Collecting Data68 Questions
Exam 2: Describing Data125 Questions
Exam 3: Confidence Intervals148 Questions
Exam 4: Hypothesis Tests119 Questions
Exam 5: Approximating With a Distribution74 Questions
Exam 6: Inference for Means and Proportions166 Questions
Exam 7: Chi-Square Tests for Categorical Variables47 Questions
Exam 8: Anova to Compare Means52 Questions
Exam 9: Inference for Regression123 Questions
Exam 10: Multiple Regression72 Questions
Exam 11: Probability Basics165 Questions
Select questions type
Two intervals are given for the same value of the explanatory variable. Which interval is the prediction interval for an individual response at this value of the explanatory variable?
Free
(Multiple Choice)
4.8/5  (33)
(33)
Correct Answer: Verified
A
Use the following
In recent years, fast food restaurants have been required to publish nutrition information about the foods they serve. Nutrition information about a random sample of 15 McDonald's lunch/dinner menu items (excluding sides and drinks) was obtained from their website. We wish to use the total fat content (in grams) to better understand the number of calories in the lunch/dinner menu items at McDonald's. Computer output from a regression analysis and a scatterplot (with regression line) of the data are provided.
Use two decimal places when reporting the results from any calculations, unless otherwise specified.
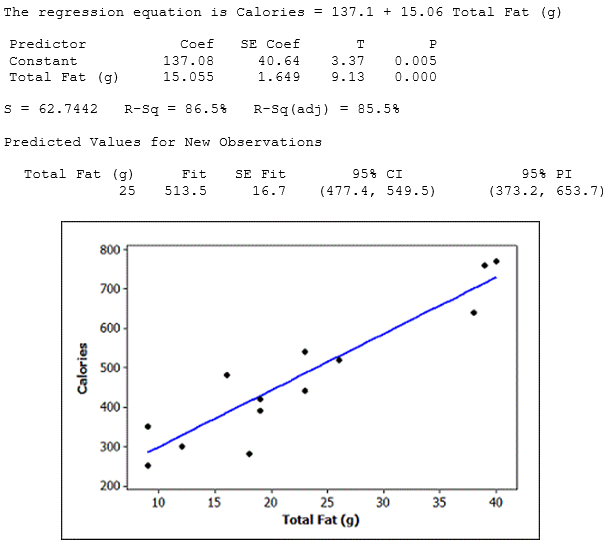 -What is the estimated slope in this regression model? Interpret the slope in context.
Free
(Essay)
4.9/5 (30)
Correct Answer:Verified
b1 = 15.06
For each additional gram of fat in McDonald's lunch/dinner menu items, we predict the number of calories to increase by 15.06 calories.
Use the following
A quantitatively savvy, young couple is interested in purchasing a home in northern New York. They collected data on houses that had recently sold in the area. They want to predict the selling price of homes (in thousands of dollars) based on the age of the home (in years). Some summary statistics, partial regression output, and a scatterplot of the relationship (with regression line) are provided.
Use two decimal places when reporting the results from any calculations, unless otherwise specified.
 The regression equation is Price (in thousands) = 193 - 0.665 Age
Analysis of Variance
The regression equation is Price (in thousands) = 193 - 0.665 Age
Analysis of Variance

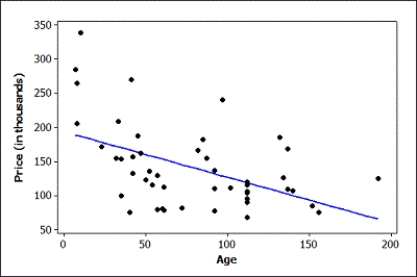 -Use the provided output to compute and interpret R2.
Free
(Essay)
4.7/5 (32)
Correct Answer:Verified
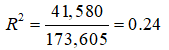
24% of the variability in the selling price of the sample recently sold home is explained by the age of the home.
Use the following
In a regression analysis with n = 25, SSE = 1,800 and SSTotal = 2,000.
-Compute R2.
(Essay)
4.9/5 (39)
Use the following
Data were collected on the mileage (in thousands of miles) and price (in thousands of dollars) of a random sample of used Hyundai Elantras. A scatterplot of the data (with regression line), some summary statistics, and partial computer output from a regression analysis are provided.
Use three decimal places when reporting the results from any calculations, unless otherwise specified.
 The regression equation is Price = 13.8 - 0.0912 Mileage

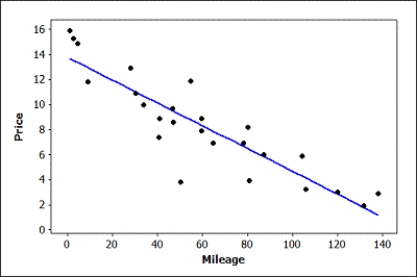 -Use the provided computer output to compute the standard deviation of the error term.
(Essay)
4.8/5 (42)
Use the following
A quantitatively savvy, young couple is interested in purchasing a home in northern New York. They collected data on 48 houses that had recently sold in the area. They want to predict the selling price of homes (in thousands of dollars) based on the size of the home (in square feet).
The regression equation is Price (in thousands) = 17.1 + 0.0643 Size (sq. ft.)
 S = 48.5733 R-Sq = 37.5% R-Sq(adj) = 36.1%
Predicted Values for New Observations
S = 48.5733 R-Sq = 37.5% R-Sq(adj) = 36.1%
Predicted Values for New Observations

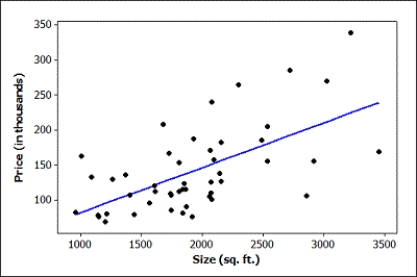 -Based on the available information, what is the correlation between selling price (in thousands) and size (square feet) of the sample of recently sold homes? Use three decimal places in your answer.
(Essay)
4.8/5 (37)
Use the following
Data were collected on the mileage (in thousands of miles) and price (in thousands of dollars) of a random sample of used Hyundai Elantras. A scatterplot of the data (with regression line), some summary statistics, and partial computer output from a regression analysis are provided.
Use three decimal places when reporting the results from any calculations, unless otherwise specified.
The regression equation is Price = 13.8 - 0.0912 Mileage
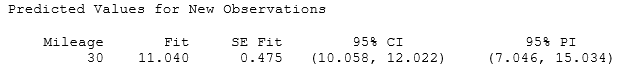
-Use the following computer output to identify and interpret a 95% interval for the mean price of all used Hyundai Elantras with 30,000 miles.
(Essay)
4.8/5 (34)
Use the following
In recent years, fast food restaurants have been required to publish nutrition information about the foods they serve. Nutrition information about a random sample of McDonald's lunch/dinner menu items (excluding sides and drinks) was obtained from their website. We wish to use the sodium content (in milligrams) to better understand the number of calories in the lunch/dinner menu items at McDonald's. Some summary statistics, partial computer output from a regression analysis, and a scatterplot (with regression line) of the data are provided.
Use two decimal places when reporting the results from any calculations, unless otherwise specified.
 The regression equation is Calories = 99.69 + 0.3698 Sodium (mg)

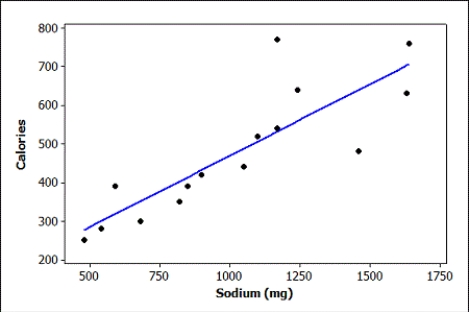 -The website also provides information about the sugar content in the menu items at McDonald's. For this sample of lunch/dinner menu items, the correlation between number of calories and sugar content (in grams) is 0.35. Test, at the 5% significance level, if there is a significant linear association between number of calories and sugar content for McDonald's lunch/dinner menu items. Include all details of the test.
(Essay)
4.7/5 (35)
Use the following
A quantitatively savvy, young couple is interested in purchasing a home in northern New York. They collected data on houses that had recently sold in the area. They want to predict the selling price of homes (in thousands of dollars) based on the age of the home (in years). Some summary statistics, partial regression output, and a scatterplot of the relationship (with regression line) are provided.
Use two decimal places when reporting the results from any calculations, unless otherwise specified.
The regression equation is Price (in thousands) = 193 - 0.665 Age
Analysis of Variance
-Use the information in the ANOVA table to determine how many homes were used in the sample.
(Short Answer)
4.8/5 (38)
Use the following
A quantitatively savvy, young couple is interested in purchasing a home in northern New York. They collected data on houses that had recently sold in the area. They want to predict the selling price of homes (in thousands of dollars) based on the age of the home (in years). Some summary statistics, partial regression output, and a scatterplot of the relationship (with regression line) are provided.
Use two decimal places when reporting the results from any calculations, unless otherwise specified.
The regression equation is Price (in thousands) = 193 - 0.665 Age
Analysis of Variance
-Use the scatterplot to determine whether we should have any major concerns about the conditions being met for using a linear model with these data. Explain briefly.
(Essay)
4.9/5 (42)
Use the following
In recent years, fast food restaurants have been required to publish nutrition information about the foods they serve. Nutrition information about a random sample of 15 McDonald's lunch/dinner menu items (excluding sides and drinks) was obtained from their website. We wish to use the total fat content (in grams) to better understand the number of calories in the lunch/dinner menu items at McDonald's. Computer output from a regression analysis and a scatterplot (with regression line) of the data are provided.
Use two decimal places when reporting the results from any calculations, unless otherwise specified.
-What are the degrees of freedom for constructing a confidence interval for, or performing a test about, the population slope?
(Multiple Choice)
4.8/5 (42)
Use the following
In recent years, fast food restaurants have been required to publish nutrition information about the foods they serve. Nutrition information about a random sample of McDonald's lunch/dinner menu items (excluding sides and drinks) was obtained from their website. We wish to use the sodium content (in milligrams) to better understand the number of calories in the lunch/dinner menu items at McDonald's. Some summary statistics, partial computer output from a regression analysis, and a scatterplot (with regression line) of the data are provided.
Use two decimal places when reporting the results from any calculations, unless otherwise specified.
The regression equation is Calories = 99.69 + 0.3698 Sodium (mg)
-Use the following output to identify and interpret a 95% interval for the number of calories in a single McDonald's lunch/dinner menu item with 800 mg of sodium.
Predicted Values for New Observations

(Essay)
4.8/5 (46)
Use the following
A quantitatively savvy, young couple is interested in purchasing a home in northern New York. They collected data on houses that had recently sold in the area. They want to predict the selling price of homes (in thousands of dollars) based on the age of the home (in years). Some summary statistics, partial regression output, and a scatterplot of the relationship (with regression line) are provided.
Use two decimal places when reporting the results from any calculations, unless otherwise specified.
The regression equation is Price (in thousands) = 193 - 0.665 Age
Analysis of Variance
-Is there evidence of a negative correlation between the selling price of homes in this portion of northern New York and their age? Use  = 0.05. Include all details of the test.
(Essay)
4.9/5 (34)
Use the following
A quantitatively savvy, young couple is interested in purchasing a home in northern New York. They collected data on 48 houses that had recently sold in the area. They want to predict the selling price of homes (in thousands of dollars) based on the size of the home (in square feet).
The regression equation is Price (in thousands) = 17.1 + 0.0643 Size (sq. ft.)
S = 48.5733 R-Sq = 37.5% R-Sq(adj) = 36.1%
Predicted Values for New Observations
-What are the degrees of freedom for constructing a confidence interval for, or performing a test about, the population slope?
(Multiple Choice)
4.8/5 (30)
Use the following
Students in a small statistics course wanted to investigate if forearm length (in cm) was useful for predicting foot length (in cm). The data they collected are displayed in the provided scatterplot (with regression), and the computer output from the analysis is provided.
Use three decimal places when reporting the results from any calculations, unless otherwise specified.
The regression equation is Foot (cm) = 9.22 + 0.574 Forearm (cm)

 Predicted Values for New Observations

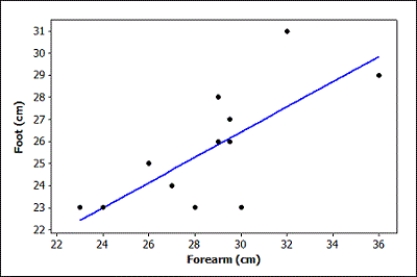 -Use the fitted model to predict the foot length for someone whose arm is 30 cm long. Report your answer with two decimal places.
(Essay)
4.8/5 (38)
Use the following
A quantitatively savvy, young couple is interested in purchasing a home in northern New York. They collected data on 48 houses that had recently sold in the area. They want to predict the selling price of homes (in thousands of dollars) based on the size of the home (in square feet).
The regression equation is Price (in thousands) = 17.1 + 0.0643 Size (sq. ft.)
S = 48.5733 R-Sq = 37.5% R-Sq(adj) = 36.1%
Predicted Values for New Observations
-Use the computer output to test the slope, at the 5% level, to determine whether size (in square feet) is an effective predictor of the selling price of recently sold homes. Include all details of the test.
(Essay)
4.9/5 (25)
Use the following
A quantitatively savvy, young couple is interested in purchasing a home in northern New York. They collected data on 48 houses that had recently sold in the area. They want to predict the selling price of homes (in thousands of dollars) based on the size of the home (in square feet).
The regression equation is Price (in thousands) = 17.1 + 0.0643 Size (sq. ft.)
S = 48.5733 R-Sq = 37.5% R-Sq(adj) = 36.1%
Predicted Values for New Observations
-Use the computer output to provide and interpret a 95% interval for the mean selling price of all 2,000 square foot houses in this portion of northern New York.
(Essay)
4.8/5 (33)
Use the following
Data were collected on GPA and number of Facebook friends for students in a small statistics class. Some summary statistics, partial output from the regression analysis, and a scatterplot of the data (with regression line) are provided. Assume that students in this class are typical of all students at the university.
Use three decimal places when reporting the results from any calculations, unless otherwise specified.
 The regression equation is GPA = 3.830 - 0.000919 FacebookFriends

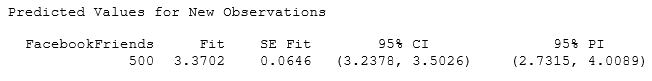
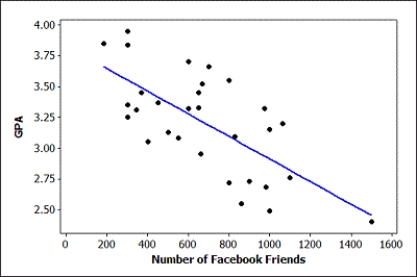 -Use the following output to identify and interpret a 95% interval for the GPA of a single student with 500 Facebook friends.
(Essay)
4.9/5 (33)
Use the following to answer questions :
Computer output from a regression analysis is provided.
 -What is the standard error of the sample slope?
(Multiple Choice)
4.9/5 (33)
Filters
- Essay(0)
- Multiple Choice(0)
- Short Answer(0)
- True False(0)
- Matching(0)