Exam 5: Approximating With a Distribution
Exam 1: Collecting Data68 Questions
Exam 2: Describing Data125 Questions
Exam 3: Confidence Intervals148 Questions
Exam 4: Hypothesis Tests119 Questions
Exam 5: Approximating With a Distribution74 Questions
Exam 6: Inference for Means and Proportions166 Questions
Exam 7: Chi-Square Tests for Categorical Variables47 Questions
Exam 8: Anova to Compare Means52 Questions
Exam 9: Inference for Regression123 Questions
Exam 10: Multiple Regression72 Questions
Exam 11: Probability Basics165 Questions
Select questions type
Use the following
Use the provided density function to choose the best estimate for the proportion of the population found in the specified region.
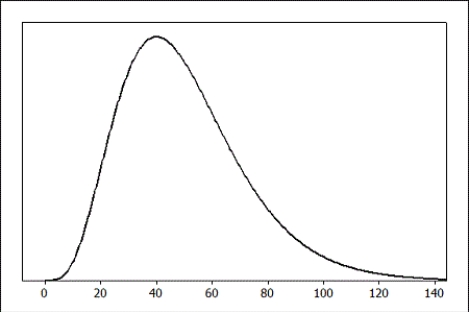 -The percent of the population between 20 and 80 is closest to
Free
(Multiple Choice)
4.9/5  (39)
(39)
Correct Answer: Verified
A
Use the following
Heights of 10-year-old girls (5th graders) follow an approximately normal distribution with mean  = 54.4 inches and standard deviation of
  = 2.7 inches.
-What proportion of 10-year-old girls are taller than 60 inches (5 feet)? Report your answer with three decimal places.
= 2.7 inches.
-What proportion of 10-year-old girls are taller than 60 inches (5 feet)? Report your answer with three decimal places.
Free
(Short Answer)
4.8/5 (35)
Correct Answer:Verified
0.019
Use the following
Heights of 10-year-old girls (5th graders) follow an approximately normal distribution with mean = 54.4 inches and standard deviation of = 2.7 inches.
-What is the first quartile of heights of 10-year-old girls? Report your answer with one decimal place.
Free
(Essay)
4.9/5 (33)
Correct Answer:Verified
Here we are looking for the 25th percentile.
52.6 inches
Use the following
In the following, convert an area from one normal distribution to an equivalent area for a different normal distribution. Show details of your calculation. Draw sketches of both normal distributions, find and label the endpoints, and shade the regions on both curves.
-The "Q1" for a standard normal distribution converted to a N(15, 2.5) distribution.
(Essay)
4.8/5 (39)
Use the following
A set of hypotheses, some information from one or more samples, and a standard error from a randomization distribution are provided. Find the value of the standardized z-test statistic.
-Test  and
and  when the samples have n1 = 35,
  = 78, s1 = 15, n2 = 40,
  = 72, and s2 = 12. The standard error of
  from the randomization distribution is 3.2.
(Multiple Choice)
5.0/5 (36)
Use the following
Find the z* values based on a standard normal distribution for each of the following.
-A 66% confidence interval for a slope.
(Multiple Choice)
4.8/5 (37)
Use the following
Robins are common birds in North America. Suppose that the wingspan of robins is approximately normal with mean 14 inches and standard deviation 0.7 inches.
-What proportion of robins have wingspans less than 13 inches? Report your answer with three decimal places.
(Short Answer)
4.9/5 (34)
Use the following
Robins are common birds in North America. Suppose that the wingspan of robins is approximately normal with mean 14 inches and standard deviation 0.7 inches.
-What proportion of robins have wingspans longer 15.5 inches? Report your answer with three decimal places.
(Short Answer)
4.8/5 (38)
Use the following
It is generally believed that the heights of adults males in the U.S. are approximately normally distributed with mean 70 inches (5 feet, 10 inches) and standard deviation 3 inches and that the heights of adult females in the U.S. are also approximately normally distributed with mean 64 inches (5 feet, 4 inches) and standard deviation 2.5 inches. A small university is considering custom ordering beds for their dorm rooms. Answer the following questions about the lengths of beds in dorm rooms at this university.
-The university plans on ordering custom sized beds such that 99% of male students are expect to fit in them when lying perfectly straight. What length beds should they order? Round your answer to the nearest inch.
(Essay)
4.8/5 (40)
Use the following
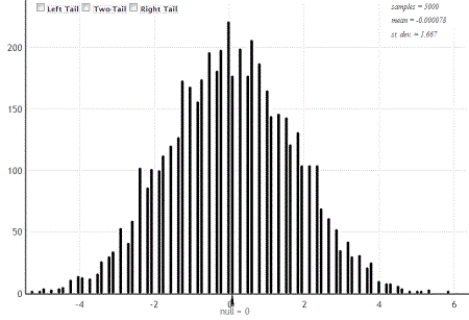
There are 24 students enrolled in an introductory statistics class at a small university. As an in-class exercise the students were asked how many hours of television they watch each week. The nm = 13 male students watched an average of 6 hours of television per week with standard deviation 4.24 hours. The nf = 11 female students watched an average of 3.91 hours of televion per week with a standard deviation of 3.48 hours. Assume that the students enrolled in the statistics class are representative of all students at the university.
-The randomization distribution for  (where
  and
and  are the sample mean amount of television watched by male and female students, respectively) is provided. Would it be appropriate to use the normal distribution to perform a test comparing the mean amount of television watched per week by male and female students at this university? Explain briefly.
(Essay)
4.9/5 (45)
Use the following
Find the z* values based on a standard normal distribution for each of the following.
-An 88% confidence interval for a correlation.
(Multiple Choice)
4.8/5 (33)
Use the following
Select the answer closest to the specified areas for a normal density.
-The area to the left of 32 on a N(45, 8) distribution.
(Multiple Choice)
4.7/5 (44)
Use the following
Final grades in Professor Albert's large calculus class are approximately normally distributed with a mean of 76 (%) and standard deviation of 8 (%).
-In Professor Albert's course, students who earn less than a 60% in the class are assigned a failing grade (F). What proportion of the students earned F's? Report your answer with three decimal places.
(Short Answer)
4.8/5 (33)
Use the following
It is generally believed that the heights of adults males in the U.S. are approximately normally distributed with mean 70 inches (5 feet, 10 inches) and standard deviation 3 inches and that the heights of adult females in the U.S. are also approximately normally distributed with mean 64 inches (5 feet, 4 inches) and standard deviation 2.5 inches. A small university is considering custom ordering beds for their dorm rooms. Answer the following questions about the lengths of beds in dorm rooms at this university.
-The university decides it is too expensive to replace all the beds. Suppose the university has 2,150 beds all of which are 75 inches long. How many beds should they replace? You may assume that only those males taller than 75 inches will receive the longer beds and that females make up half of the population that will need a dorm room bed.
(Essay)
4.8/5 (38)
A sample of 148 college students reports sleeping an average of 6.85 hours on weeknights. The sample size is large enough to use the normal distribution, and a bootstrap distribution shows that the standard error is SE = 0.175. Use a normal distribution to construct and interpret a 95% confidence interval for the mean amount of weeknight sleep students get at this university. Use two decimal places in your answer.
(Essay)
4.9/5 (38)
Use the following
In an August 2012 Gallup survey of 1,012 randomly selected U.S. adults (age 18 and over), 53% said that they were dissatisfied with the quality of education students receive in kindergarten through grade 12. The bootstrap distribution (based on 5,000 samples) is provided.
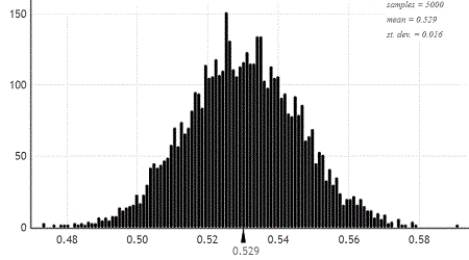 -The standard error from the bootstrap distribution is SE = 0.016. Use the normal distribution to construct and interpret a 99% confidence interval for the proportion of U.S. adults who are dissatisfied with the education students receive in kindergarten through grade 12. Round to three decimal places.
(Essay)
4.9/5 (35)
Use the following
Select the answer closest to the specified areas for a N(0, 1) density.
-The area outside of the interval z = -2.13 and z = 1.11.
(Multiple Choice)
4.8/5 (36)
Use the following
Robins are common birds in North America. Suppose that the wingspan of robins is approximately normal with mean 14 inches and standard deviation 0.7 inches.
-Draw a sketch of this normal distribution and label at least three points on the horizontal axis.
(Essay)
4.8/5 (27)
Use the following
Find the p-value based on a standard normal distribution for the standardized test statistic and provided alternative hypothesis.
-z = 1.75 for 
(Multiple Choice)
4.7/5 (34)
A biologist interested in estimating the correlation between the body mass (in grams) and body length (in cm) of porcupines has a random sample of 18 porcupines with r = 0.407. The bootstrap distribution she constructed is approximately normal and the standard error is estimated to be 0.165. Use the normal distribution to construct and interpret a 98% confidence interval for the correlation between body mass and body length in porcupines. Round all values to three decimal places.
(Essay)
4.9/5 (42)
Filters
- Essay(0)
- Multiple Choice(0)
- Short Answer(0)
- True False(0)
- Matching(0)