Exam 6: Inference for Means and Proportions
Exam 1: Collecting Data68 Questions
Exam 2: Describing Data125 Questions
Exam 3: Confidence Intervals148 Questions
Exam 4: Hypothesis Tests119 Questions
Exam 5: Approximating With a Distribution74 Questions
Exam 6: Inference for Means and Proportions166 Questions
Exam 7: Chi-Square Tests for Categorical Variables47 Questions
Exam 8: Anova to Compare Means52 Questions
Exam 9: Inference for Regression123 Questions
Exam 10: Multiple Regression72 Questions
Exam 11: Probability Basics165 Questions
Select questions type
Use the following
A 1997 study described in the European Journal of Clinical Nutrition compares the growth of vegetarian and omnivorous children, ages 7 - 11, in Northwest England. In the study, each of the 50 vegetarian children in the study was matched with an omnivorous child of the same age with similar demographic characteristics. One of the aspects on which the children were compared was their body mass index (BMI). The differences in BMI for each pair of children (one vegetarian and one omnivore) was computed as vegetarian BMI minus omnivore BMI.
 -Test, at the 5% level, if there is evidence that the mean BMI for vegetarian children differs significantly from the mean BMI for omnivorous children. Include all of the details of the test.
Free
(Essay)
4.8/5  (46)
(46)
Correct Answer: Verified
 = mean BMI for vegetarian children
 = mean BMI for omnivorous children
(alternatively they could define  to represent the mean difference, where the differences are defined as d = veg. - omniv.)

Test statistic:  = -0.946
The sample size is fairly large so we can use the t-distribution with 49 degrees of freedom to compute the p-value for the test.
p-value = 0.349 (two-tail, using Statkey)
Because the p-value is considerably larger than the 5% significance level, we have no evidence to reject Ho and thus have no evidence to conclude that the mean BMI for vegetarian children differs significantly from the mean BMI for omnivorous children.
Use the following
Consider taking random samples of size 50 from Population A with proportion 0.45 and random samples of size 40 from Population B with proportion 0.38.
-Find the mean of the distribution of differences in sample proportions, . 
Free
(Multiple Choice)
4.9/5 (42)
Correct Answer:Verified
C
Use the following
In an August 2012 Gallup survey of 1,012 randomly selected U.S. adults (age 18 and over), 53% said that they were dissatisfied with the quality of education students receive in kindergarten through grade 12.
-Verify that the sample is large enough to use the normal formula to find a confidence interval for the proportion of Americans who are dissatisfied with the quality of education students receive in kindergarten through grade 12.
Free
(Essay)
4.8/5 (26)
Correct Answer:Verified
 = 0.53
 = 536.36 > 10,
  = 475.64 > 10 <-- Yes, we can use the normal formula
Use the following
The Math and Verbal SAT scores for a random sample of 10 students from a large introductory statistics course are provided.
 -Test, at the 10% level, if Math SAT scores are significantly higher, on average, than Verbal SAT scores for students in the class. Include all of the details of the test.
(Essay)
4.8/5 (34)
Use the following
Every year since the 1957-58 academic year, the National Science Foundation (NSF) conducts its Survey of Earned Doctorates (SED) of all individuals receiving research doctoral degrees from accredited U.S. institutions. The results from the 2010 survey published on the NSF website indicate that 78.2% of individuals earning their doctorate in the physical sciences have no graduate debt while 48.3% of those earning their doctorate in the social sciences have no graduate debt. Of the 48,069 research doctorates granted in 2010, 93% completed the SED, thus the information collected by the NSF can be good approximations of the population parameters.
-Suppose we take random samples of 50 individuals who earned a doctorate in the physical sciences (in 2010) and 25 individuals who earned a doctorate in the social sciences (in 2010). Find the mean and standard error (using four decimal places) of the distribution of differences in sample proportions (  ), and indicate if the sample sizes are large enough to use the Central Limit Theorem.
(Essay)
4.9/5 (31)
Use the following
In 2012 the Centers for Disease Control and Prevention reported that in a sample of 4,349 African Americans 31% were Vitamin D deficient. Overall, it is believed that Vitamin D deficiency affects 8% of all U.S. adults.
-Verify that the sample size is large enough to use a normal distribution to conduct a test comparing the population proportion of African Americans with Vitamin D deficiency to the overall rate of 8%.
(Essay)
4.8/5 (42)
Use the following
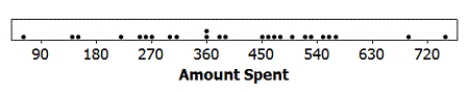
"Black Friday,"
which occurs annually the day after Thanksgiving, is one of the biggest shopping days of the year. During the 2012 holiday season, many stores created controversy by starting their mega-sales on Thanksgiving itself. In a random sample of 25 individuals who shopped during the Black Friday four-day weekend (Thursday - Sunday), the average amount spent was $399.40 with standard deviation $171.10. The data are displayed in the provided dotplot.
 -Does your confidence interval provide evidence that the average amount spent over the 2011 Black Friday weekend differs from the average amount spent over the 2012 Black Friday weekend? Explain briefly.
(Essay)
4.8/5 (37)
Use the following
Suppose that the makers of M&M's claim that 24% of their Milk Chocolate M&M's are blue.
-For which sample sizes (Fun-Size with 20, Vending Machine with 55, or Medium with 415) would the Central Limit Theorem apply?
(Essay)
4.7/5 (28)
Use the following
February 12, 2009 marked the 200th anniversary of Charles Darwin's birth. To celebrate, Gallup, a national polling organization, surveyed 1,018 randomly selected American adults about their education level and their beliefs about the theory of evolution. In their sample, 325 of their respondents had some college education and 228 were college graduates. Among the 325 respondents with some college education, 133 said that they believed in the theory of evolution. Among the 228 respondents who were college graduates, 121 said that they believed in the theory of evolution.
-Test, at the 10% level, if there is evidence that the proportion of college graduates that believe in evolution differs significantly from the proportion of individuals with some college education that believe in evolution. Include all of the details of the test.
(Essay)
4.8/5 (48)
Use the following
For each of the following, find the mean and standard error of the distribution of sample means. Use two decimal places when reporting your standard error.
-Samples of size 50 from a population with mean 450 and standard deviation 75.
(Essay)
4.9/5 (38)
Use the following
Consider taking random samples of size 50 from Population A with proportion 0.45 and random samples of size 40 from Population B with proportion 0.38.
-Find the standard error of the distribution of differences in sample proportions, . 
(Multiple Choice)
5.0/5 (35)
Use the following
Zumba, often described as a Latin-inspired dance fitness party, is currently one of the most popular group fitness classes, but its health benefits have been little studied. An exercise science professor at a large university conducted a study to investigate some of the health benefits of Zumba. He recorded the weight of 9 female college students before they began a six week long Zumba program. As part of the program, they took a 60 minute long Zumba class three days a week. At the end of the program, the subjects were weighed again. Of interest is their weight loss, defined as weight before the program started minus weight after completing the program. The results are displayed in the following table.
 The mean weight loss for the sample was 2.667 pounds with standard deviation 2.5 pounds. A dotplot of the differences is provided.
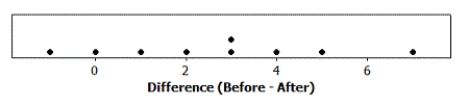 -Test, at the 1% level, if there is evidence that the Zumba program is effective for weight loss. Include all of the details of the test.
(Essay)
4.8/5 (31)
Use the following
Admissions records at a small university indicates that 6.7% of the students enrolled are international students.
-For which sample sizes (n = 50, n = 100, and n = 200) would the Central Limit Theorem apply?
(Essay)
5.0/5 (29)
Use the following
"Black Friday,"
which occurs annually the day after Thanksgiving, is one of the biggest shopping days of the year. During the 2012 holiday season, many stores created controversy by starting their mega-sales on Thanksgiving itself. In a random sample of 25 individuals who shopped during the Black Friday four-day weekend (Thursday - Sunday), the average amount spent was $399.40 with standard deviation $171.10. The data are displayed in the provided dotplot.
-Construct a 95% confidence interval for the average amount spent by individuals who shopped over the 2012 Black Friday weekend. Use two decimal places in your margin of error.
(Essay)
4.9/5 (32)
Use the following
November 6, 2012 was election day. Many of the major television networks aired coverage of the incoming election results during the primetime hours. The provided boxplot displays the amount of time (in minutes) spent watching election coverage for a random sample of 25 U.S. adults. In this sample, the average time spent watching election coverage was 80.44 minutes with standard deviation of 43.99 minutes.
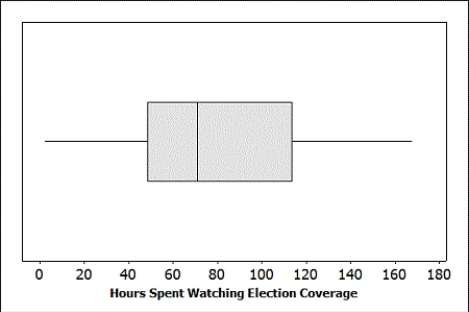 -What sample size would we need to estimate the average amount of time U.S. adults watching election coverage with 99% confidence and a margin of error of
  5 hours?
(Essay)
4.9/5 (37)
Use the following
Situations comparing two proportions are described. In each case, determine whether the situation involves comparing proportions for two groups or comparing two proportions from the same group.
-Comparing the proportion of milk chocolate M&M's that are blue to the proportion of dark chocolate M&M's that are blue.
(Multiple Choice)
5.0/5 (33)
Use the following
A 1997 study described in the European Journal of Clinical Nutrition compares the growth of vegetarian and omnivorous children, ages 7 - 11, in Northwest England. In the study, each of the 50 vegetarian children in the study was matched with an omnivorous child of the same age with similar demographic characteristics. One of the aspects on which the children were compared was their body mass index (BMI). The differences in BMI for each pair of children (one vegetarian and one omnivore) was computed as vegetarian BMI minus omnivore BMI.
-Construct a 95% confidence interval for the difference in mean BMI between vegetarian and omnivorous children. Use three decimal places in your margin of error.
(Essay)
4.8/5 (42)
Use the following
In May 2012 President Obama made history by revealing his support of gay marriage. Around that time the Gallup Organization polled 1,024 U.S. adults about their opinions on gay/lesbian relations and gay marriage. They found that 54% of those sampled viewed gay/lesbian relations as "morally acceptable".
-Construct a 90% confidence interval for the proportion of U.S. adults who find gay/lesbian relations to be "morally acceptable". Round the margin of error to three decimal places.
(Essay)
4.8/5 (37)
Use the following
November 6, 2012 was election day. Many of the major television networks aired coverage of the incoming election results during the primetime hours. The provided boxplot displays the amount of time (in minutes) spent watching election coverage for a random sample of 25 U.S. adults. In this sample, the average time spent watching election coverage was 80.44 minutes with standard deviation of 43.99 minutes.
-Construct a 90% confidence interval for the average amount of time U.S. adults spent watching election coverage. Use two decimal places in your margin of error.
(Essay)
4.7/5 (40)
Use the following
A random sample of 48 students at a large university reported getting an average of 7 hours of sleep on weeknights, with standard deviation 1.62 hours. A dotplot of the data is provided.
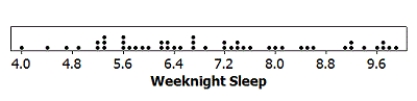 -Construct a 95% confidence interval for the average amount of weeknight sleep for students at this university. Round the margin of error to two decimal places.
(Essay)
4.9/5 (43)
Filters
- Essay(0)
- Multiple Choice(0)
- Short Answer(0)
- True False(0)
- Matching(0)