Exam 8: Anova to Compare Means
Exam 1: Collecting Data68 Questions
Exam 2: Describing Data125 Questions
Exam 3: Confidence Intervals148 Questions
Exam 4: Hypothesis Tests119 Questions
Exam 5: Approximating With a Distribution74 Questions
Exam 6: Inference for Means and Proportions166 Questions
Exam 7: Chi-Square Tests for Categorical Variables47 Questions
Exam 8: Anova to Compare Means52 Questions
Exam 9: Inference for Regression123 Questions
Exam 10: Multiple Regression72 Questions
Exam 11: Probability Basics165 Questions
Select questions type
Use the following
An environmental studies student working on an independent research project was investigating metal contamination in the St. Lawrence River. The metals can accumulate in organisms that live in the river (known as bioaccumulation). He collected samples of Quagga mussels at three sites in the St. Lawrence River and measured the concentration of copper (in micrograms per gram,  or mcg/g) in the mussels. His data are summarized in the provided table and plot. He wants to know if there are any significant differences in mean copper concentration among the three sites

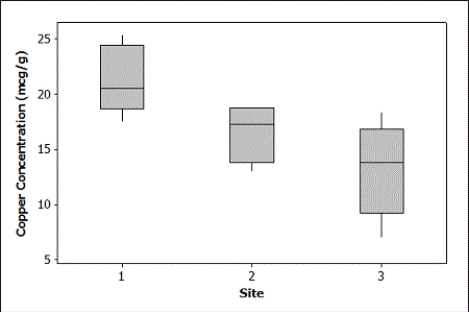 -Construct the ANOVA table and test, using
  = 0.05, for a difference in mean copper concentration among the three sites. Round decimal values to two decimal places. Include all details of the test
(Essay)
4.9/5  (45)
(45)
Use the following
Penalties in ice hockey occur when a player breaks one of the rules of the game. In most cases, when a penalty occurs, the offending player is placed in the penalty box (the length of time spent in the penalty box depends on the severity of the penalty), and the team has to play with fewer people on the ice, which can result in an advantage for the opposing team. The number of penalties per game for several randomly selected games are displayed for three college men's ice hockey teams.
 -Use the summary information and results from the ANOVA to construct 95% confidence intervals for the differences in each pair of means:
(a) Team A and Team B
(b) Team A and Team C
(c) Team B and Team C
In each case, round the margin of error to two decimal places. Based on your work, which teams have significantly different means? Briefly justify your answer.
-Use the summary information and results from the ANOVA to construct 95% confidence intervals for the differences in each pair of means:
(a) Team A and Team B
(b) Team A and Team C
(c) Team B and Team C
In each case, round the margin of error to two decimal places. Based on your work, which teams have significantly different means? Briefly justify your answer.
(Essay)
4.8/5 (34)
Use the following
Summary statistics from a dataset and the corresponding computer analysis of variance output are provided.

 -What degrees of freedom are used in doing inferences for these means and differences in means after ANOVA?
(Multiple Choice)
4.8/5 (26)
Use the following
An environmental studies student working on an independent research project was investigating metal contamination in the St. Lawrence River. The metals can accumulate in organisms that live in the river (known as bioaccumulation). He collected samples of Quagga mussels at three sites in the St. Lawrence River and measured the concentration of copper (in micrograms per gram, or mcg/g) in the mussels. His data are summarized in the provided table and plot. He wants to know if there are any significant differences in mean copper concentration among the three sites
-Computer output from the analysis provides the following information about the pairwise differences:
Site = 1 subtracted from
 I
Site = 2 subtracted from
I
Site = 2 subtracted from
 Based on this output, which sites have significantly different means? Briefly justify your answer.
(Essay)
4.9/5 (32)
Use the following
The sample sizes for the groups in a dataset and an outline of an analysis of variance table with partial information are provided. Fill in the missing parts of the table. Round decimal answers to two decimal places.
-Three groups with n1 = 10, n2 = 10, and n3 = 10.

(Essay)
4.7/5 (39)
Use the following
An environmental studies student working on an independent research project was investigating metal contamination in the St. Lawrence River. The metals can accumulate in organisms that live in the river (known as bioaccumulation). He collected samples of Quagga mussels at three sites in the St. Lawrence River and measured the concentration of copper (in micrograms per gram, or mcg/g) in the mussels. His data are summarized in the provided table and plot. He wants to know if there are any significant differences in mean copper concentration among the three sites
-Are the conditions for using ANOVA reasonably satisfied? Explain briefly.
(Essay)
4.8/5 (29)
Use the following
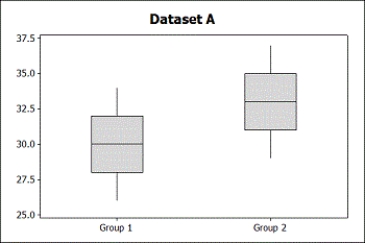
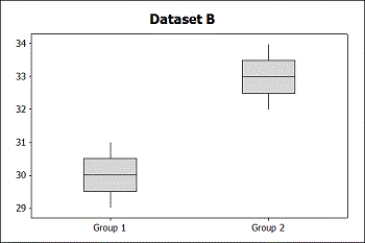
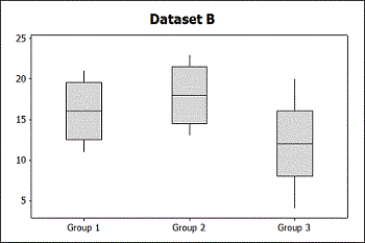
Two sets of sample data, A and B, are given. Without doing any calculations, indicate in which set of sample data, A or B, there is likely to be stronger evidence of a difference in the population means. Give a brief reason, comparing means and variability, for your answer.
-
(Essay)
5.0/5 (34)
Use the following
An environmental studies student working on an independent research project was investigating metal contamination in the St. Lawrence River. The metals can accumulate in organisms that live in the river (known as bioaccumulation). He collected samples of Quagga mussels at three sites in the St. Lawrence River and measured the concentration of copper (in micrograms per gram, or mcg/g) in the mussels. His data are summarized in the provided table and plot. He wants to know if there are any significant differences in mean copper concentration among the three sites
-Computer output from the analysis is provided:
One-way ANOVA: Copper Concentration (mcg/g) versus Sit
 Test, using
  = 0.05, for a difference in mean copper concentration among the three sites. Include all details of the test
(Essay)
4.8/5 (33)
Use the following
Summary statistics from a dataset and the corresponding computer analysis of variance output are provided.
-Find a 90% confidence interval for the mean of population A. Round the margin of error to three decimal places.
(Essay)
4.9/5 (45)
Use the following
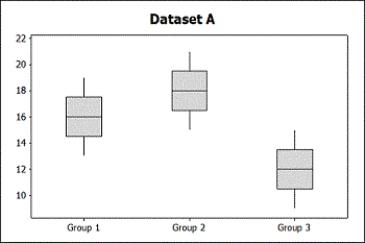
Two sets of sample data, A and B, are given. Without doing any calculations, indicate in which set of sample data, A or B, there is likely to be stronger evidence of a difference in the population means. Give a brief reason, comparing means and variability, for your answer.
-
(Essay)
4.9/5 (33)
Use the following
A small university is concerned with monitoring its electricity usage in its Student Center. Specifically, its officials want to know if the amount of electricity used differs by day of the week. They collected data for nearly a year, and the relevant summary statistics are provided. Note that electricity usage is measured in kilowatt hours.
 -Are the conditions for using ANOVA reasonably satisfied? Explain briefly.
(Essay)
4.8/5 (31)
Analysis of variance is used to test for significant differences among
(Multiple Choice)
4.8/5 (41)
Filters
- Essay(0)
- Multiple Choice(0)
- Short Answer(0)
- True False(0)
- Matching(0)