Exam 15: Public Choice, Taxes, and the Distribution of Income
Exam 1: Economics: Foundations and Models145 Questions
Exam 2: Trade-Offs, Comparative Advantage, and the Market System151 Questions
Exam 3: Where Prices Come From: the Interaction of Demand and Supply159 Questions
Exam 4: Economic Efficiency, Government Price Setting, and Taxes127 Questions
Exam 5: Externalities, Environmental Policy, and Public Goods141 Questions
Exam 6: Elasticity: the Responsiveness of Demand and Supply149 Questions
Exam 7: Comparative Advantage and the Gains From International Trade125 Questions
Exam 8: Consumer Choice and Behavioral Economics154 Questions
Exam 9: Technology, Production, and Costs169 Questions
Exam 10: Firms in Perfectly Competitive Markets153 Questions
Exam 11: Monopolistic Competition140 Questions
Exam 12: Oligopoly: Firms in Less Competitive Markets130 Questions
Exam 13: Monopoly and Antitrust Policy146 Questions
Exam 14: The Markets for Labour and Other Factors of Production149 Questions
Exam 15: Public Choice, Taxes, and the Distribution of Income134 Questions
Exam 16: Pricing Strategy132 Questions
Exam 17: Firms, the Stock Market, and Corporate Governance137 Questions
Select questions type
The median voter theorem states that the outcome of a majority vote
(Multiple Choice)
4.9/5  (39)
(39)
Unlike the market process, in the political market it is possible for some individuals to receive very large benefits from the political process without any significant impact on their tax bills.
(True/False)
4.9/5 (37)
Table 15.1
Ivy Jasmine Rose Subsidies for education 2nd 3rd 1st Research on Alzheimer's 3rd 1st 2nd Subsidies for daycare 1 st 2nd 3rd
Suppose $1 billion is available in the budget and Parliament is considering allocating the funds to one of the following three alternatives: 1)Subsidies for education, 2)Research on Alzheimer's or 3)Subsidies for daycare. Table 15.1 shows three voters' rankings of the alternatives.
-Refer to Table 15.1.Suppose a series of votes are taken in which each pair of alternatives is considered in turn.If the vote is between allocating funds to subsidies for education and research on Alzheimer's,
(Multiple Choice)
4.9/5 (38)
Between 1976 and 2010, income inequality in Canada has increased in part due to rapid technological change.How does technological change contribute to income inequality?
(Multiple Choice)
4.8/5 (34)
Absolute poverty measures vary from country to country.For example, in 2012, the low income cut-off in Canada was an annual income of approximately $20,000 but economists often use a much lower threshold income of $1 per day when calculating the rate of poverty in poor countries.How is this absolute poverty measured?
(Multiple Choice)
4.9/5 (34)
Compare the distribution of income in Canada with the distribution of income in other high-income countries.
(Essay)
4.8/5 (32)
Table 15.6
Income Quintile Agraria Percentage of Total Income Urbana Percentage of Total Income Lowest 20\% 3\% 5\% Second quintile 9\% 14\% Third quintile 14\% 20\% Fourth quintile 24\% 24\% Highest 20\% 50\% 37\%
Table 15.6 shows income distribution data for two countries. Use this data to answer the following questions.
-Refer to Table 15.6.
a.Draw a Lorenz curve for each country.
b.Which country has the more equal distribution of income?
c.Based on the Lorenz curve for the two countries, can you determine which country has the more progressive tax system? Explain your answer.
(Essay)
4.9/5 (39)
Figure 15.1
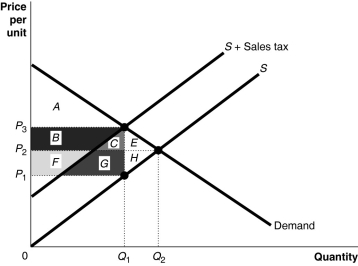 -Refer to Figure 15.1.The sales tax revenue collected by the government is represented by the area
(Multiple Choice)
4.9/5 (29)
Some economists who use the public choice model to explain the ways government intervenes in the economy believe that regulatory capture results when an agency or commission is given authority over a particular industry or product.Which of the following is the best example of regulatory capture?
(Multiple Choice)
4.7/5 (30)
Describe the main factors economists believe cause inequality of income.
(Essay)
4.9/5 (45)
Figure 15.1
-Refer to Figure 15.1.The excess burden of the tax is represented by the area
(Multiple Choice)
4.8/5 (35)
If the government is most interested in minimizing excess burden of an excise tax, should it impose the tax on goods that are elastic or on goods that are inelastic?
(Essay)
4.7/5 (36)
Filters
- Essay(0)
- Multiple Choice(0)
- Short Answer(0)
- True False(0)
- Matching(0)