Exam 15: Public Choice, Taxes, and the Distribution of Income
Exam 1: Economics: Foundations and Models145 Questions
Exam 2: Trade-Offs, Comparative Advantage, and the Market System151 Questions
Exam 3: Where Prices Come From: the Interaction of Demand and Supply159 Questions
Exam 4: Economic Efficiency, Government Price Setting, and Taxes127 Questions
Exam 5: Externalities, Environmental Policy, and Public Goods141 Questions
Exam 6: Elasticity: the Responsiveness of Demand and Supply149 Questions
Exam 7: Comparative Advantage and the Gains From International Trade125 Questions
Exam 8: Consumer Choice and Behavioral Economics154 Questions
Exam 9: Technology, Production, and Costs169 Questions
Exam 10: Firms in Perfectly Competitive Markets153 Questions
Exam 11: Monopolistic Competition140 Questions
Exam 12: Oligopoly: Firms in Less Competitive Markets130 Questions
Exam 13: Monopoly and Antitrust Policy146 Questions
Exam 14: The Markets for Labour and Other Factors of Production149 Questions
Exam 15: Public Choice, Taxes, and the Distribution of Income134 Questions
Exam 16: Pricing Strategy132 Questions
Exam 17: Firms, the Stock Market, and Corporate Governance137 Questions
Select questions type
Figure 15.2
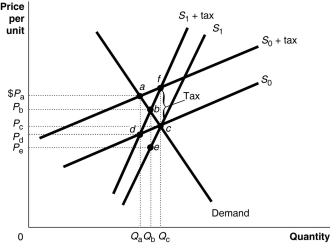 Figure 15.2 shows a demand curve and two sets of supply curves, one set more elastic than the other.
-Refer to Figure 15.2.If the government imposes an excise tax of $1.00 on every unit sold, the government's revenue from the tax is represented by the area
Figure 15.2 shows a demand curve and two sets of supply curves, one set more elastic than the other.
-Refer to Figure 15.2.If the government imposes an excise tax of $1.00 on every unit sold, the government's revenue from the tax is represented by the area
(Multiple Choice)
4.8/5  (35)
(35)
What is the difference between the voting paradox and the Arrow impossibility theorem?
(Essay)
4.9/5 (37)
All of the following occur whenever a government taxes a product except
(Multiple Choice)
5.0/5 (40)
Why would most people not consider a university student as suffering from poverty?
(Multiple Choice)
4.8/5 (41)
Figure 15.6
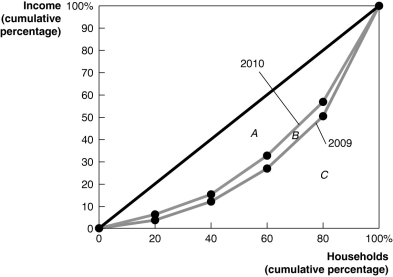 -Refer to Figure 15.6 to answer the following questions.
a.Did the distribution of income become more equal in 2010 that it was in 2009, or did it become less equal? Explain.
b.If area A = 1,600, area B = 200, and area C = 3,200, calculate the Gini coefficient for 2009 and the Gini coefficient for 2010.
-Refer to Figure 15.6 to answer the following questions.
a.Did the distribution of income become more equal in 2010 that it was in 2009, or did it become less equal? Explain.
b.If area A = 1,600, area B = 200, and area C = 3,200, calculate the Gini coefficient for 2009 and the Gini coefficient for 2010.
(Essay)
4.8/5 (38)
When the majority of voters have preferences very different from those of the median voter, then the median voter theorem will lead to accurate predictions of the outcomes of elections.
(True/False)
4.7/5 (32)
Figure 15.2
Figure 15.2 shows a demand curve and two sets of supply curves, one set more elastic than the other.
-Refer to Figure 15.2.If the government imposes an excise tax of $1.00 on every unit sold, what is the size of the deadweight loss, if there is any?
(Multiple Choice)
4.9/5 (32)
Table 15.3
Taxable Income Tax Payments \ 20,000 \ 2,000 25,000 2,250 32,000 2,560 42,000 2,940
Table 15.3 shows the amount of taxes paid on various levels of income in Notrealia.
-Refer to Table 15.3.Notrealia's tax system is
(Multiple Choice)
4.8/5 (42)
If you pay $2,000 in taxes on an income of $20,000, and a tax of $2,700 on an income of $30,000, then over this range of income the tax is
(Multiple Choice)
4.9/5 (33)
Suppose the United States has a Gini coefficient of 0.4 and Sweden has a Gini coefficient of 0.25.Which of the following statements is true?
(Multiple Choice)
4.9/5 (37)
Figure 15.1
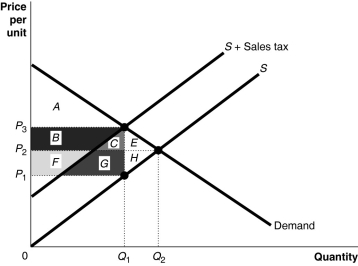 -Refer to Figure 15.1.Of the tax revenue collected by the government, the portion borne by producers is represented by the area
(Multiple Choice)
4.8/5 (39)
If the marginal tax rate is less than the average tax rate as taxable income increases, the tax structure is
(Multiple Choice)
4.9/5 (36)
Rapid economic growth tends to increase the degree of income mobility.
(True/False)
4.8/5 (42)
Figure 15.5
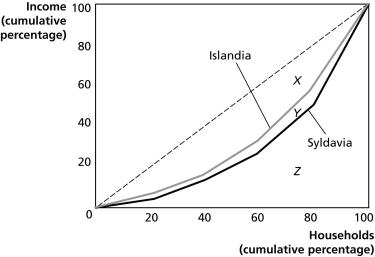 Figure 15.5 shows the Lorenz curves for Islandia and Syldavia.
-Refer to Figure 15.5.Which country has the more unequal distribution of income?
Figure 15.5 shows the Lorenz curves for Islandia and Syldavia.
-Refer to Figure 15.5.Which country has the more unequal distribution of income?
(Multiple Choice)
4.9/5 (37)
Filters
- Essay(0)
- Multiple Choice(0)
- Short Answer(0)
- True False(0)
- Matching(0)