Exam 4: Demand and Supply
Exam 1: Getting Started337 Questions
Exam 2: The Us and Global Economies201 Questions
Exam 3: The Economic Problem273 Questions
Exam 4: Demand and Supply322 Questions
Exam 5: Elasticities of Demand and Supply335 Questions
Exam 6: Efficiency and Fairness of Markets352 Questions
Exam 7: Government Actions in Markets349 Questions
Exam 8: Global Markets in Action276 Questions
Exam 9: Externalities: Pollution, Education, and Health Care290 Questions
Exam 10: Production and Cost266 Questions
Exam 11: Perfect Competition275 Questions
Exam 12: Monopoly377 Questions
Exam 13: Monopolistic Competition and Oligopoly316 Questions
Exam 14: Gdp: a Measure of Total Production and Income253 Questions
Exam 15: Jobs and Unemployment283 Questions
Exam 16: The Cpi and the Cost of Living263 Questions
Exam 17: Potential Gdp and Economic Growth328 Questions
Exam 18: Money and the Monetary System360 Questions
Exam 19: Aggregate Supply and Aggregate Demand301 Questions
Exam 20: Fiscal Policy and Monetary Policy223 Questions
Select questions type
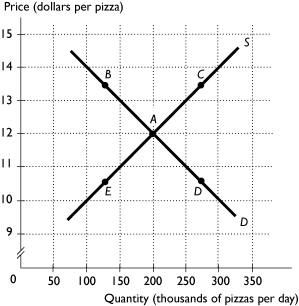 -The above figure shows the market for pizza. The market is in equilibrium when some of the pizza firms go out of business. What point represents the most likely new price and quantity?
Free
(Multiple Choice)
4.7/5  (39)
(39)
Correct Answer: Verified
B
You are just about to finish college and are about to start a high paying job. Because of this new job, what is the most likely outcome in the market for cars?
Free
(Multiple Choice)
4.8/5 (44)
Correct Answer:Verified
C
A decrease in the price of a complement in production leads to
Free
(Multiple Choice)
4.9/5 (41)
Correct Answer:Verified
A
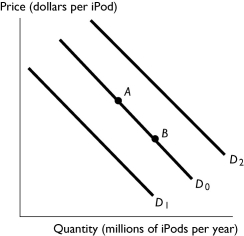 -The figure above shows the market for iPods. Which of the following creates a movement from point A to point B?
(Multiple Choice)
4.9/5 (34)
The number of people looking to buy ceiling fan buyers increases, so there is an increase in the
(Multiple Choice)
4.9/5 (39)
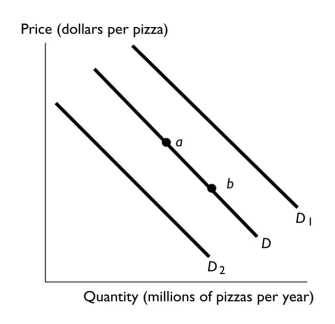 -In the above figure, the movement from point a to point b reflects
(Multiple Choice)
4.8/5 (33)
What is the effect on the price and quantity of a product if both the demand and supply simultaneously increase?
(Essay)
4.8/5 (44)
Soft drinks are a normal good. Draw a graph showing the effect of an increase in income on the demand for soft drinks.
(Essay)
4.8/5 (39)
-The figure above shows the market for iPods. Which of the following shifts the demand curve from D₀ to D₁?
(Multiple Choice)
4.8/5 (37)
Suppose that the number of companies selling computer software decreases. How does this change affect the supply of computer software and the supply curve of computer software?
(Essay)
4.8/5 (35)
Which of the following is correct?
I. A surplus puts downward pressure on the price of a good.
Ii. A shortage puts upward pressure on the price of a good.
Iii. There is no surplus or shortage at equilibrium.
(Multiple Choice)
4.8/5 (30)
Changes in which of the following factors do NOT shift the demand curve?
(Multiple Choice)
4.7/5 (36)
Suppose that over the next few years the demand for dancing to country and western music decreases. Hence, at country and western dance clubs the equilibrium price of admission ________ and the equilibrium quantity of dancing ________.
(Multiple Choice)
4.9/5 (32)
Because of the high cost of fuel, railroads such as Union Pacific Corp and CSX Corp have increased the price they charge to haul freight. This change means that the
(Multiple Choice)
4.7/5 (33)
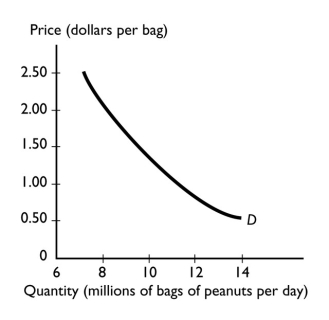 -The graph illustrates the demand for peanuts. Peanuts are a normal good because the
(Multiple Choice)
4.9/5 (43)
If the price of carrots is below the equilibrium price, the
(Multiple Choice)
4.8/5 (35)
Which of the following increases the supply of a good and shifts its supply curve rightward?
(Multiple Choice)
4.9/5 (38)
Consider the market for bread. If the price of wheat rises, then the
(Multiple Choice)
4.9/5 (34)
A competitive market is in equilibrium. Then there is a decrease in demand and a decrease in supply. The equilibrium price ________, and the equilibrium quantity ________.
(Multiple Choice)
4.9/5 (42)
Filters
- Essay(0)
- Multiple Choice(0)
- Short Answer(0)
- True False(0)
- Matching(0)