Exam 19: Aggregate Supply and Aggregate Demand
Exam 1: Getting Started337 Questions
Exam 2: The Us and Global Economies201 Questions
Exam 3: The Economic Problem273 Questions
Exam 4: Demand and Supply322 Questions
Exam 5: Elasticities of Demand and Supply335 Questions
Exam 6: Efficiency and Fairness of Markets352 Questions
Exam 7: Government Actions in Markets349 Questions
Exam 8: Global Markets in Action276 Questions
Exam 9: Externalities: Pollution, Education, and Health Care290 Questions
Exam 10: Production and Cost266 Questions
Exam 11: Perfect Competition275 Questions
Exam 12: Monopoly377 Questions
Exam 13: Monopolistic Competition and Oligopoly316 Questions
Exam 14: Gdp: a Measure of Total Production and Income253 Questions
Exam 15: Jobs and Unemployment283 Questions
Exam 16: The Cpi and the Cost of Living263 Questions
Exam 17: Potential Gdp and Economic Growth328 Questions
Exam 18: Money and the Monetary System360 Questions
Exam 19: Aggregate Supply and Aggregate Demand301 Questions
Exam 20: Fiscal Policy and Monetary Policy223 Questions
Select questions type
The money wage rate is constant when moving along
Free
(Multiple Choice)
4.7/5  (37)
(37)
Correct Answer: Verified
A
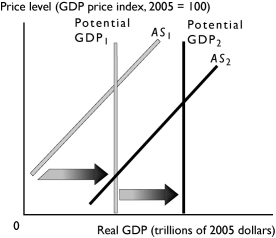 -The change in potential real GDP and aggregate supply shown in the graph above can be a result of
Free
(Multiple Choice)
4.8/5 (38)
Correct Answer:Verified
B
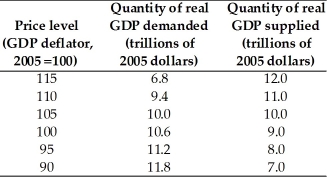 -Based on the table above,
a. What is the equilibrium price level and real GDP?
b. If potential GDP is $11.0 trillion, what does that imply about the economy's level of employment?
c. If potential GDP is $9.0 trillion, what does that imply about the economy's level of employment?
-Based on the table above,
a. What is the equilibrium price level and real GDP?
b. If potential GDP is $11.0 trillion, what does that imply about the economy's level of employment?
c. If potential GDP is $9.0 trillion, what does that imply about the economy's level of employment?
(Essay)
5.0/5 (41)
In the short-run, an increase in the price of raw materials will ________ the price level and ________ real GDP.
(Multiple Choice)
4.7/5 (30)
When the price level rises, the real interest rate ________ and the quantity of real GDP demanded ________.
(Multiple Choice)
4.8/5 (29)
If the money wage rate is constant and the price level increases, what happens to the real wage rate, firms' profits, and the aggregate quantity supplied?
(Essay)
4.9/5 (42)
The quantity of real GDP supplied increases when the price level increases because
(Multiple Choice)
4.9/5 (41)
An economy experiences a recessionary gap. As the economy adjusts to full employment, the money wage rate
(Multiple Choice)
4.9/5 (41)
Price level (GDP deflator) Potential GDP (billions of 2005 dollars) Real GDP supplied (billions of 2005 dollars) Real GDP demanded (billions of 2005 dollars) 150 25 34 16 140 25 31 19 130 25 28 22 120 25 25 25 110 25 23 28
-The table above gives data for the nation of Pearl, a small island in the South Pacific. If aggregate demand increases so that the quantity of real GDP demanded is $6 billion more at each price level, the new equilibrium real GDP is
(Multiple Choice)
4.9/5 (37)
Because there is a ________ relationship between the price level and the quantity of real GDP supplied, the aggregate supply curve is ________ curve.
(Multiple Choice)
4.8/5 (37)
If the equilibrium price level is 135 but the actual price level is 150, then
(Multiple Choice)
4.7/5 (40)
Filters
- Essay(0)
- Multiple Choice(0)
- Short Answer(0)
- True False(0)
- Matching(0)