Exam 4: Demand and Supply
Exam 1: Getting Started337 Questions
Exam 2: The Us and Global Economies201 Questions
Exam 3: The Economic Problem273 Questions
Exam 4: Demand and Supply322 Questions
Exam 5: Elasticities of Demand and Supply335 Questions
Exam 6: Efficiency and Fairness of Markets352 Questions
Exam 7: Government Actions in Markets349 Questions
Exam 8: Global Markets in Action276 Questions
Exam 9: Externalities: Pollution, Education, and Health Care290 Questions
Exam 10: Production and Cost266 Questions
Exam 11: Perfect Competition275 Questions
Exam 12: Monopoly377 Questions
Exam 13: Monopolistic Competition and Oligopoly316 Questions
Exam 14: Gdp: a Measure of Total Production and Income253 Questions
Exam 15: Jobs and Unemployment283 Questions
Exam 16: The Cpi and the Cost of Living263 Questions
Exam 17: Potential Gdp and Economic Growth328 Questions
Exam 18: Money and the Monetary System360 Questions
Exam 19: Aggregate Supply and Aggregate Demand301 Questions
Exam 20: Fiscal Policy and Monetary Policy223 Questions
Select questions type
 -The graph illustrates the supply of sweaters. A fall in the price of sweaters brings
(Multiple Choice)
4.8/5  (36)
(36)
The law of demand implies that, other things remaining the same,
(Multiple Choice)
4.8/5 (31)
Teenagers drink more soda than other age groups. If the number of teenagers increases, everything else remaining the same,
(Multiple Choice)
4.8/5 (37)
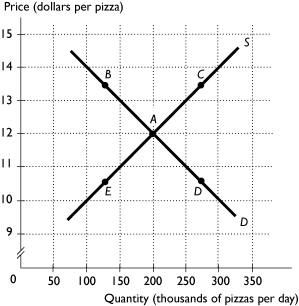 -The above figure shows the market for pizza. The market is in equilibrium when the cheese used to produce pizza falls in price. What point represents the most likely new price and quantity?
(Multiple Choice)
4.8/5 (37)
If there is a surplus of a good, the quantity demanded is ________ the quantity supplied and the price will ________.
(Multiple Choice)
5.0/5 (41)
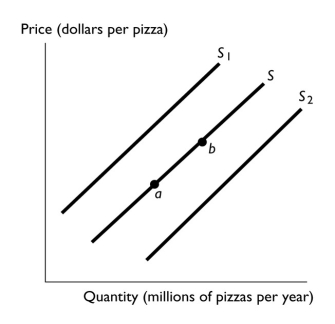 -In the above figure, the movement from point a to point b reflects
(Multiple Choice)
4.9/5 (38)
The demand for cat food decreases while the supply increases. The equilibrium price of cat food ________, and the equilibrium quantity ________.
(Multiple Choice)
4.7/5 (38)
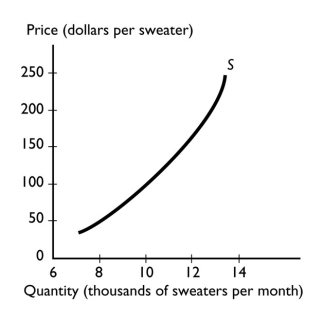 -The graph illustrates the supply of sweaters. Which of the following events will increase the quantity supplied of sweaters?
(Multiple Choice)
4.8/5 (40)
Suppose that the price of bread rises. This rise could be the result of
(Multiple Choice)
4.9/5 (31)
When moving along a demand curve, which of the following changes?
(Multiple Choice)
4.8/5 (33)
Consumers regard Dell computers and Apple computers as substitutes. If the price of a Dell computer decreases, the
(Multiple Choice)
4.7/5 (37)
In early 2012 the price of computer hard disc drives rose. In a demand and supply model, shifts in what curve or curves could have brought about the higher price?
(Essay)
4.9/5 (45)
In the above figure, the shift in the demand curve from D to D₁ can be the result of
(Multiple Choice)
4.8/5 (34)
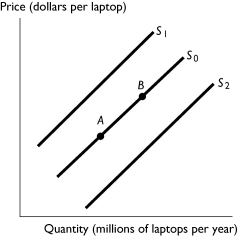 -The above figure shows the market for laptops. Which of the following causes a movement from A to B?
(Multiple Choice)
4.9/5 (30)
 -The graph illustrates the supply of sweaters. Which of the following events will increase the supply of sweaters?
(Multiple Choice)
5.0/5 (35)
What is the effect on the price and quantity of a product if the demand decreases and the supply simultaneously increases?
(Essay)
4.7/5 (35)
Last year a very severe ice storm hit the north counties of New York state, and the states of Vermont and Maine. Electric poles were down and no one had power for days. It was reported that the price of kerosene heaters skyrocketed and the number purchased increased during this time. Using a supply and demand diagram, show the impact of the ice storm on the market for kerosene heaters.
(Essay)
4.9/5 (33)
Filters
- Essay(0)
- Multiple Choice(0)
- Short Answer(0)
- True False(0)
- Matching(0)