Exam 4: Demand and Supply
Exam 1: Getting Started337 Questions
Exam 2: The Us and Global Economies201 Questions
Exam 3: The Economic Problem273 Questions
Exam 4: Demand and Supply322 Questions
Exam 5: Elasticities of Demand and Supply335 Questions
Exam 6: Efficiency and Fairness of Markets352 Questions
Exam 7: Government Actions in Markets349 Questions
Exam 8: Global Markets in Action276 Questions
Exam 9: Externalities: Pollution, Education, and Health Care290 Questions
Exam 10: Production and Cost266 Questions
Exam 11: Perfect Competition275 Questions
Exam 12: Monopoly377 Questions
Exam 13: Monopolistic Competition and Oligopoly316 Questions
Exam 14: Gdp: a Measure of Total Production and Income253 Questions
Exam 15: Jobs and Unemployment283 Questions
Exam 16: The Cpi and the Cost of Living263 Questions
Exam 17: Potential Gdp and Economic Growth328 Questions
Exam 18: Money and the Monetary System360 Questions
Exam 19: Aggregate Supply and Aggregate Demand301 Questions
Exam 20: Fiscal Policy and Monetary Policy223 Questions
Select questions type
Peanut butter and jelly are complements for many consumers. Consider the market for peanut butter. If there is an increase in the price of jelly,
(Multiple Choice)
4.9/5  (37)
(37)
Computer chips are a normal good. Suppose the economy slips into a recession so that income falls. As a result, the demand for computer chips ________ so that the price of a computer chip ________.
(Multiple Choice)
4.9/5 (33)
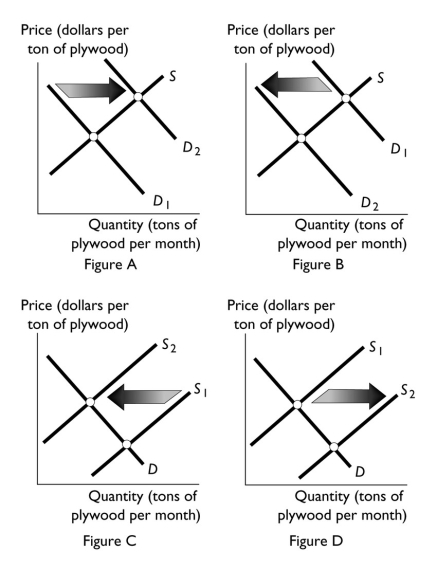 -The number of logging firms increases. Which of the figures above best illustrates this change?
(Multiple Choice)
4.7/5 (31)
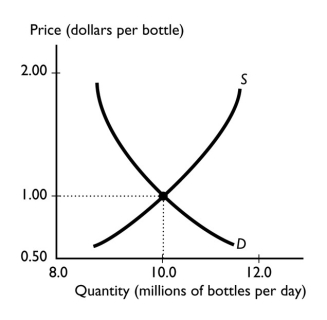 -The graph illustrates the market for bottled water. When the price exceeds the equilibrium price, the quantity demanded is ________ the quantity supplied and the price of the good will ________.
(Multiple Choice)
4.9/5 (45)
In the above figure, the shift in the supply curve from S to S₁ reflects
(Multiple Choice)
4.8/5 (35)
Kiwis and strawberries are substitutes for consumers. An increase in the price of a kiwi coupled with an increase in the number of strawberry growers ________ the equilibrium price of a pound of strawberries and ________ the equilibrium quantity of strawberries.
(Multiple Choice)
4.8/5 (41)
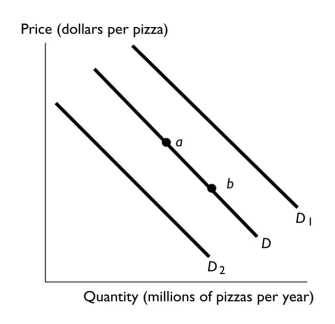 -In the above figure, the shift in the demand curve from D to D₂ can be the result of
(Multiple Choice)
4.8/5 (48)
Consider the market for wheat. If there is an improvement in harvesting technology,
(Multiple Choice)
4.8/5 (39)
Quantity demanded (tons of cat food per year) Price (dollars per pound of cat food) Quantity supplied (tons of cat food per year) 52 1.00 15 46 1.50 26 43 2.00 34 40 2.50 40 35 3.00 44
-The above table gives the demand and supply schedules for cat food. If the price is $3.00 per pound of cat food, will there be a shortage, a surplus, or is this price the equilibrium price?
If there is a shortage, how much is the shortage?
If there is a surplus, how much is the surplus?
If $3.00 is the equilibrium price, what is the equilibrium quantity?
(Essay)
4.9/5 (41)
Consider the market for peanut butter. If there is an increase in the price of peanuts,
(Multiple Choice)
4.8/5 (42)
Suppose a medical study reveals new benefits to consuming beef and at the same time a bumper corn crop reduces the cost of feeding steers. The equilibrium quantity of beef will
(Multiple Choice)
4.8/5 (44)
A change in the price of a good ________ its supply curve and ________ a movement along its supply curve.
(Multiple Choice)
4.9/5 (37)
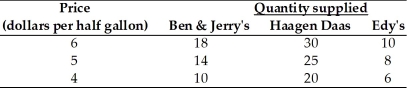 -The table above indicates how many thousands of containers of ice cream three different companies are willing to produce at different prices. Does this information reflect the law of supply?
Why or why not?
-The table above indicates how many thousands of containers of ice cream three different companies are willing to produce at different prices. Does this information reflect the law of supply?
Why or why not?
(Essay)
4.7/5 (38)
Which of the following is the best explanation for why the price of gasoline increases during the summer months?
(Multiple Choice)
4.9/5 (24)
Which of the following brings only an increase in the quantity demanded of a good?
(Multiple Choice)
4.8/5 (29)
Which of the following shifts the demand curve for movies rightward?
(Multiple Choice)
4.8/5 (38)
Suppose that the price of lettuce used to produce tacos increases. This change means that the equilibrium price of a taco ________ and the equilibrium quantity ________.
(Multiple Choice)
4.8/5 (33)
Price (dollars per gallon) Quantity demanded (gallons of gasoline) Quantity supplied (gallons of gasoline) 3.73 337,982 441,074 3.68 396,398 428,008 3.65 412,031 412,031 3.62 417,899 391,665
-The table above shows the situation in the gasoline market in Tulsa, Oklahoma. If the price of a gallon of gasoline is $3.62, then
(Multiple Choice)
4.8/5 (39)
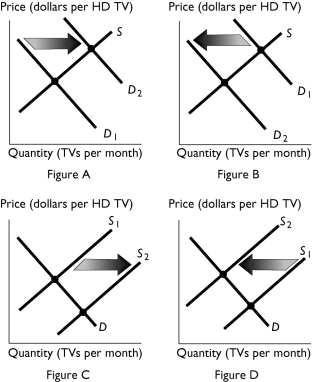 -The above figures show the market for HD televisions. If cable television providers lower the price of providing HD cable service, which figure shows the effect of this change ?
(Multiple Choice)
4.8/5 (38)
Filters
- Essay(0)
- Multiple Choice(0)
- Short Answer(0)
- True False(0)
- Matching(0)