Exam 1: Getting Started
Exam 1: Getting Started337 Questions
Exam 2: The Us and Global Economies201 Questions
Exam 3: The Economic Problem273 Questions
Exam 4: Demand and Supply322 Questions
Exam 5: Elasticities of Demand and Supply335 Questions
Exam 6: Efficiency and Fairness of Markets352 Questions
Exam 7: Government Actions in Markets349 Questions
Exam 8: Global Markets in Action276 Questions
Exam 9: Externalities: Pollution, Education, and Health Care290 Questions
Exam 10: Production and Cost266 Questions
Exam 11: Perfect Competition275 Questions
Exam 12: Monopoly377 Questions
Exam 13: Monopolistic Competition and Oligopoly316 Questions
Exam 14: Gdp: a Measure of Total Production and Income253 Questions
Exam 15: Jobs and Unemployment283 Questions
Exam 16: The Cpi and the Cost of Living263 Questions
Exam 17: Potential Gdp and Economic Growth328 Questions
Exam 18: Money and the Monetary System360 Questions
Exam 19: Aggregate Supply and Aggregate Demand301 Questions
Exam 20: Fiscal Policy and Monetary Policy223 Questions
Select questions type
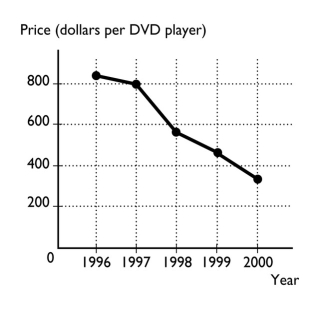 -The figure above shows the price of a DVD player from 1996 to 2000.
a. What type of graph is illustrated above?
b. What is the trend in the price of a DVD player?
-The figure above shows the price of a DVD player from 1996 to 2000.
a. What type of graph is illustrated above?
b. What is the trend in the price of a DVD player?
Free
(Essay)
4.8/5  (22)
(22)
Correct Answer: Verified
a. The graph is a time-series graph because it plots time along the horizontal axis and the price of a DVD player along the vertical axis.
b. The trend in the price of a DVD player is negative, that is, the price of a DVD player has generally decreased from one year to the next.
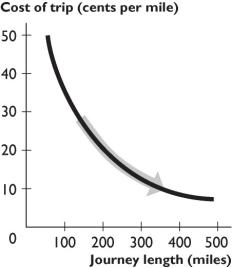 -The figure above shows the relationship between the journey length and the cost of trip per mile. The curve becomes flatter because as the journey length increases,
Free
(Multiple Choice)
4.9/5 (38)
Correct Answer:Verified
A
You have data for the amount of rainfall in 50 cities for the month of June. The type of graph to best display these data would be a
Free
(Multiple Choice)
4.9/5 (27)
Correct Answer:Verified
C
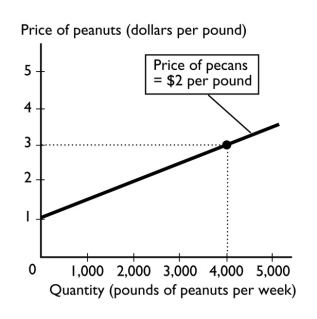 -In the figure above, suppose the price of a pound of pecans is negatively related to the quantity of peanuts that farmers are willing to supply. If the price of pecans increases,
(Multiple Choice)
4.8/5 (33)
The above figure shows the relationship between the price of a slice of pizza and how many slices of pizza Ricardo buys in a week. Between points A and B, the slope of the line is ________ the slope of the line between points B and C.
(Multiple Choice)
4.9/5 (32)
You have chosen to take a trip during spring break. If you had not gone, you would either have worked at a temporary job or studied for exams. The opportunity cost of your trip is
(Multiple Choice)
4.8/5 (41)
If x increases and as a result y decreases, then x and y are
(Multiple Choice)
4.9/5 (37)
The relationship between distance traveled in five hours and speed shown in the figure above is
(Multiple Choice)
4.8/5 (44)
Going skiing will cost Adam $80 a day. He also loses $40 per day in wages because he has to take time off from work. Adam still decides to go skiing.
(Multiple Choice)
4.9/5 (38)
A graph of the value of one variable against the value of another variable is known as a
(Multiple Choice)
4.9/5 (32)
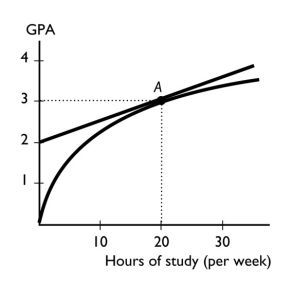 -The figure above shows the relationship between the time a student spends studying and the student's GPA that semester. The slope of the relationship at point A equals
(Multiple Choice)
4.8/5 (42)
By donating $1,000 to the Salvation Army, Caroline reduces her taxable income. To Caroline, the reduction in her taxable income is
(Multiple Choice)
4.8/5 (30)
Which of the following is a macroeconomic topic?
i. China increases interest rates to slow its economic growth.
ii. Congress lowers tax rates to try and lower the unemployment rate.
iii. Nissan decides to produce more electric Leaf models and fewer Altima sedans.
(Multiple Choice)
4.9/5 (37)
Which of the following statements is a normative statement?
(Multiple Choice)
4.7/5 (41)
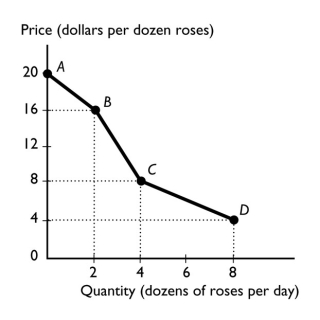 -The figure above shows the relationship between the price of a dozen roses and the quantity of roses a florist can sell. The slope between points C and D equals
(Multiple Choice)
4.9/5 (33)
The tendency for the values of two variables to move in a predictable and related way is known as
(Multiple Choice)
4.9/5 (39)
Filters
- Essay(0)
- Multiple Choice(0)
- Short Answer(0)
- True False(0)
- Matching(0)