Exam 19: Aggregate Supply and Aggregate Demand
Exam 1: Getting Started337 Questions
Exam 2: The Us and Global Economies201 Questions
Exam 3: The Economic Problem273 Questions
Exam 4: Demand and Supply322 Questions
Exam 5: Elasticities of Demand and Supply335 Questions
Exam 6: Efficiency and Fairness of Markets352 Questions
Exam 7: Government Actions in Markets349 Questions
Exam 8: Global Markets in Action276 Questions
Exam 9: Externalities: Pollution, Education, and Health Care290 Questions
Exam 10: Production and Cost266 Questions
Exam 11: Perfect Competition275 Questions
Exam 12: Monopoly377 Questions
Exam 13: Monopolistic Competition and Oligopoly316 Questions
Exam 14: Gdp: a Measure of Total Production and Income253 Questions
Exam 15: Jobs and Unemployment283 Questions
Exam 16: The Cpi and the Cost of Living263 Questions
Exam 17: Potential Gdp and Economic Growth328 Questions
Exam 18: Money and the Monetary System360 Questions
Exam 19: Aggregate Supply and Aggregate Demand301 Questions
Exam 20: Fiscal Policy and Monetary Policy223 Questions
Select questions type
Which of the following produces a movement along the aggregate demand curve and does not shift the aggregate demand curve?
(Multiple Choice)
4.9/5  (30)
(30)
As a result of OPEC ________ oil prices in 1973 and 1980, real GDP in United States ________.
(Multiple Choice)
4.9/5 (30)
A change in any component of aggregate demand creates a larger change in overall aggregate demand. This is the ________ effect, and it means , for example, that a ________ in consumption will cause an even larger ________ in AD.
(Multiple Choice)
4.8/5 (49)
The economy is at full employment. If aggregate demand increases,
(Multiple Choice)
4.8/5 (36)
Does a rise in the price level bring a movement along the aggregate supply curve or does it shift the aggregate supply curve?
(Essay)
4.9/5 (32)
Which of the following shifts the aggregate supply curve rightward?
(Multiple Choice)
4.9/5 (36)
The government increases the level of government expenditure. If there is no change in the aggregate supply curve, then aggregate demand will ________, real GDP will ________, and the price level will ________.
(Multiple Choice)
4.9/5 (45)
If demand pull inflation occurs when the economy is already at potential GDP, then following the initial increase in aggregate demand, the
(Multiple Choice)
4.8/5 (43)
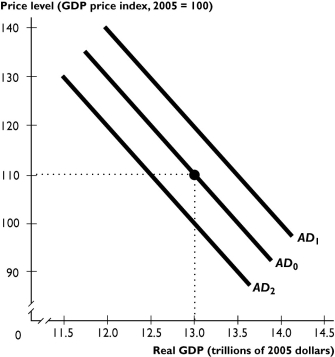 The figure above shows aggregate demand curves.
-Based on the figure above, the aggregate demand curve will shift from AD₀ to AD₂ when
The figure above shows aggregate demand curves.
-Based on the figure above, the aggregate demand curve will shift from AD₀ to AD₂ when
(Multiple Choice)
4.7/5 (39)
19.4 Chapter Figures
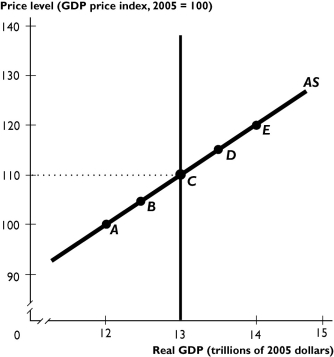 The figure above shows the aggregate supply curve and potential GDP.
-If potential GDP increases, then in the figure above the potential GDP line ________, and the aggregate supply curve ________.
The figure above shows the aggregate supply curve and potential GDP.
-If potential GDP increases, then in the figure above the potential GDP line ________, and the aggregate supply curve ________.
(Multiple Choice)
4.8/5 (41)
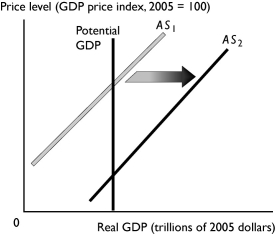 -The change reflected in the above figure might be a result of
(Multiple Choice)
4.8/5 (40)
A technological advance ________ potential GDP, ________ aggregate supply, and shifts the aggregate supply curve ________.
(Multiple Choice)
4.8/5 (29)
The slope of the aggregate supply curve shows that, all else the same, the
(Multiple Choice)
4.9/5 (37)
Filters
- Essay(0)
- Multiple Choice(0)
- Short Answer(0)
- True False(0)
- Matching(0)