Exam 19: Aggregate Supply and Aggregate Demand
Exam 1: Getting Started337 Questions
Exam 2: The Us and Global Economies201 Questions
Exam 3: The Economic Problem273 Questions
Exam 4: Demand and Supply322 Questions
Exam 5: Elasticities of Demand and Supply335 Questions
Exam 6: Efficiency and Fairness of Markets352 Questions
Exam 7: Government Actions in Markets349 Questions
Exam 8: Global Markets in Action276 Questions
Exam 9: Externalities: Pollution, Education, and Health Care290 Questions
Exam 10: Production and Cost266 Questions
Exam 11: Perfect Competition275 Questions
Exam 12: Monopoly377 Questions
Exam 13: Monopolistic Competition and Oligopoly316 Questions
Exam 14: Gdp: a Measure of Total Production and Income253 Questions
Exam 15: Jobs and Unemployment283 Questions
Exam 16: The Cpi and the Cost of Living263 Questions
Exam 17: Potential Gdp and Economic Growth328 Questions
Exam 18: Money and the Monetary System360 Questions
Exam 19: Aggregate Supply and Aggregate Demand301 Questions
Exam 20: Fiscal Policy and Monetary Policy223 Questions
Select questions type
In the figure above, the economy is at an equilibrium with real GDP of $10 trillion and a price level of 110. As the economy moves toward its ultimate equilibrium, the ________ curve will shift ________.
(Multiple Choice)
4.8/5  (32)
(32)
The aggregate demand curve illustrates the relationship between
(Multiple Choice)
4.8/5 (45)
An economy is at a full-employment equilibrium, and then the aggregate demand curve shifts leftward. As a result, the price level ________ and real GDP ________.
(Multiple Choice)
4.8/5 (41)
A combination of declining real GDP and rising price level is referred to as
(Multiple Choice)
4.9/5 (42)
State how shifts in the aggregate demand curve can explain the movement of real GDP around potential GDP.
(Essay)
4.8/5 (45)
Price level (GDP deflator) Potential GDP (billions of 2005 dollars) Real GDP supplied (billions of 2005 dollars) Real GDP demanded (billions of 2005 dollars) 150 25 34 16 140 25 31 19 130 25 28 22 120 25 25 25 110 25 23 28
-The table above gives data for the nation of Pearl, a small island in the South Pacific. If a supply shock decreases the quantity of real GDP supplied by $6 billion at each price level, the new equilibrium real GDP is
(Multiple Choice)
4.7/5 (33)
"Moving along the AS curve, the real wage rate is constant while moving along the potential GDP line, the real wage rate changes." Explain whether the previous statement is correct or incorrect.
(Essay)
4.8/5 (33)
During the late 1960s, U.S. defense spending increased as the United States fought in Vietnam. This increase in government expenditure on goods and services most likely created
(Multiple Choice)
4.7/5 (37)
At a trough in the business cycle, the macroeconomic equilibrium is ________ the level of potential real GDP.
(Multiple Choice)
5.0/5 (36)
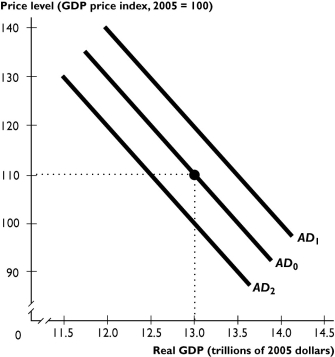 The figure above shows aggregate demand curves.
-Based on the figure above, the aggregate demand curve will shift from AD₀ to AD₂ when
The figure above shows aggregate demand curves.
-Based on the figure above, the aggregate demand curve will shift from AD₀ to AD₂ when
(Multiple Choice)
4.8/5 (31)
If the equilibrium price level is 135 but the actual price level is 120, then
(Multiple Choice)
4.8/5 (34)
Which of the following factors could start a demand-pull inflation ?
(Multiple Choice)
5.0/5 (32)
What two variables are determined in an aggregate supply-aggregate demand figure?
Is the slope of the aggregate supply curve positive or negative?
Is the slope of the aggregate demand curve positive or negative?
(Essay)
4.8/5 (35)
________ increases the quantity of real GDP supplied and is shown as a movement along the AS curve.
(Multiple Choice)
4.8/5 (32)
If the aggregate demand curve and the aggregate supply curve intersect at a level of real GDP less than potential GDP, there is
(Multiple Choice)
4.9/5 (41)
Filters
- Essay(0)
- Multiple Choice(0)
- Short Answer(0)
- True False(0)
- Matching(0)