Exam 12: Inferential Analysis
Exam 1: Introduction70 Questions
Exam 2: Ethics Foundations of Ethics in Research70 Questions
Exam 3: Qualitative Approaches to Research70 Questions
Exam 4: Sampling Foundations of Sampling70 Questions
Exam 5: Introduction to Measurement70 Questions
Exam 6: Scales, Tests, and Indexes70 Questions
Exam 7: Survey Research70 Questions
Exam 8: Introduction to Design70 Questions
Exam 9: Experimental Design70 Questions
Exam 10: Quasi-Experimental Design70 Questions
Exam 11: Introduction to Data Analysis70 Questions
Exam 12: Inferential Analysis57 Questions
Exam 13: Communicating Research70 Questions
Select questions type
Dummy variables act like _______________.
Free
(Short Answer)
4.8/5  (31)
(31)
Correct Answer: Verified
switches
The lack of random assignment in quasi-experimental designs makes their analysis considerably easier.
Free
(True/False)
4.8/5 (34)
Correct Answer:Verified
False
In a 2 x 2 factorial design,there are two main effects and two interaction effects.
Free
(True/False)
4.8/5 (32)
Correct Answer:Verified
False
Figure TB 11-3
-In the accompanying formula,β3 represents the____.
(Multiple Choice)
4.8/5 (37)
The term in a regression equation that captures the residual in describing each point is the ____ term.
(Multiple Choice)
4.9/5 (38)
Dummy variables are useful because they enable you to use a single regression equation to represent multiple _______________.
(Short Answer)
4.9/5 (35)
A common metric for comparing and integrating results across studies is _______________.
(Short Answer)
4.9/5 (33)
A(n)_______________ line is a line that describes the relationship between two or more variables.
(Short Answer)
4.8/5 (34)
The General Linear Model is the major framework for statistical modeling in the social sciences.
(True/False)
4.9/5 (38)
The randomized block design reduces noise or variance in the data.
(True/False)
4.8/5 (39)
The vertical distance from a point to the regression line is the ____.
(Multiple Choice)
4.9/5 (39)
The line that describes the relationship between two or more variables is a(n)____ line.
(Multiple Choice)
4.7/5 (38)
The numerical variable used to represent subgroups of the sample is the ____.
(Multiple Choice)
4.8/5 (37)
Figure TB 11-3
-The accompanying formula is the regression model for the____.
(Multiple Choice)
4.9/5 (38)
An analysis that estimates the difference between the groups on the posttest after adjusting for differences on the pretest is _______________.
(Short Answer)
4.8/5 (32)
Variables that are adjusted for in a research study are called ____.
(Multiple Choice)
5.0/5 (32)
Figure TB 11-1
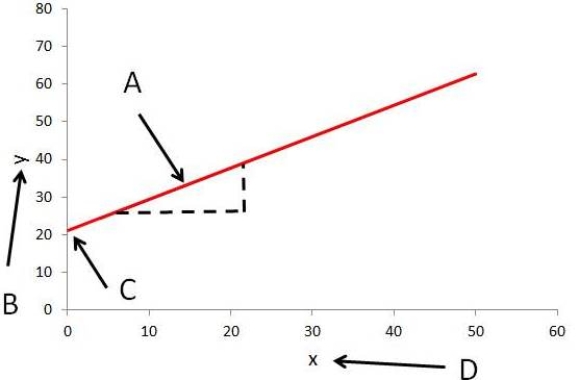 -In the accompanying figure,A refers to the ____.
(Multiple Choice)
4.8/5 (36)
Filters
- Essay(0)
- Multiple Choice(0)
- Short Answer(0)
- True False(0)
- Matching(0)