Exam 7: Between the Extremes: Interaction and Strategy
Exam 1: Reasoning With Economics: Models and Information75 Questions
Exam 2: Transactions and Institutions: the Building Blocks80 Questions
Exam 3: Markets76 Questions
Exam 4: Cost and Production67 Questions
Exam 5: Extreme Markets I: Perfect Competition68 Questions
Exam 6: Extreme Markets II: Monopoly69 Questions
Exam 7: Between the Extremes: Interaction and Strategy66 Questions
Exam 8: Competition and Strategy70 Questions
Exam 9: Beyond Markets; Property and Contracts67 Questions
Exam 10: The Economics of Contracts67 Questions
Exam 11: Risk and Information in Contracts67 Questions
Exam 12: Organizations in Concept and Practice67 Questions
Exam 13: Organizational Design64 Questions
Exam 14: Vertical Relationships66 Questions
Exam 15: Employment Relationships69 Questions
Exam 16: Time, Risk and Options73 Questions
Exam 17: Conflict, Negotiation and Group Choice68 Questions
Select questions type
The figure given below represents the total output and price produced in an oligopoly market characterized by a dominant firm and a fringe.SF represents the supply curve of the fringe, D is the market demand curve, DRES represents the residual demand curve of the dominant firm, MRRES represents the residual marginal revenue curve of the dominant firm, and MCD represents the marginal cost of the dominant firm.
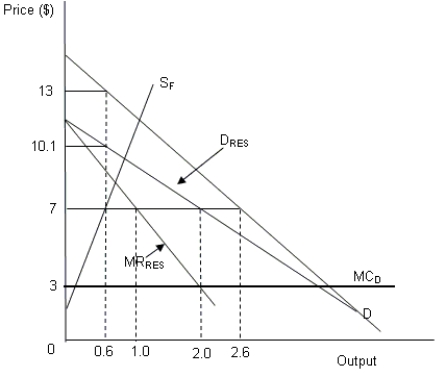 -Refer to Figure .If the market demand curve D rotates outward (while its vertical intercept remains unchanged), which of the following changes will be observed in the oligopoly market?
(Multiple Choice)
4.9/5  (33)
(33)
Why do competitive firms enter the market in spite of the price war threatened by the dominant firm?
(Essay)
4.8/5 (38)
In games without dominant strategies the Nash equilibrium can be found by using:
(Multiple Choice)
4.8/5 (36)
The figure given below represents the total output and price produced in an oligopoly market characterized by a dominant firm and a fringe.SF represents the supply curve of the fringe, D is the market demand curve, DRES represents the residual demand curve of the dominant firm, MRRES represents the residual marginal revenue curve of the dominant firm, and MCD represents the marginal cost of the dominant firm.
-Refer to Figure .What will be the dominant firm's profit maximizing output?
(Multiple Choice)
4.9/5 (37)
In a Betrand price-setting duopoly model, the equilibrium output:
(Multiple Choice)
4.9/5 (29)
The figure given below represents the total output and price produced in an oligopoly market characterized by a dominant firm and a fringe.SF represents the supply curve of the fringe, D is the market demand curve, DRES represents the residual demand curve of the dominant firm, MRRES represents the residual marginal revenue curve of the dominant firm, and MCD represents the marginal cost of the dominant firm.
-Refer to Figure .If the supply curve of the fringe SF becomes steeper, which of the following changes will be observed in the oligopoly market?
(Multiple Choice)
4.9/5 (30)
Post deregulation, airlines attempted to maintain their earlier profit levels by instituting price discrimination in such forms as advance purchase ticket restrictions and frequent-flyer mileage programs.These methods generally did not succeed in maintaining those profit levels.
(True/False)
4.9/5 (35)
Suppose the market demand curve (D) in an oligopoly market characterized by a dominant firm and a fringe is given by Q = 25 - 2P.The fringe supply curve is given by QF = -1 + 0.3P.If the marginal cost of production for the dominant is $3, calculate the market price and total output produced by the dominant firm and the fringe.
(Multiple Choice)
4.8/5 (32)
The figure given below represents the total output and price produced in an oligopoly market characterized by a dominant firm and a fringe.SF represents the supply curve of the fringe, D is the market demand curve, DRES represents the residual demand curve of the dominant firm, MRRES represents the residual marginal revenue curve of the dominant firm, and MCD represents the marginal cost of the dominant firm.
-Refer to Figure .Assume that in the long run new firms enter the market lowering the total cost incurred by the fringe firms below the same incurred by the dominant firm.Which of the following situations will arise?
(Multiple Choice)
4.8/5 (28)
The figure given below represents the total output and price produced in an oligopoly market characterized by a dominant firm and a fringe.SF represents the supply curve of the fringe, D is the market demand curve, DRES represents the residual demand curve of the dominant firm, MRRES represents the residual marginal revenue curve of the dominant firm, and MCD represents the marginal cost of the dominant firm.
-Refer to Figure .What will be the fringe's profit maximizing output?
(Multiple Choice)
4.9/5 (33)
The following matrix represents the payoffs to two producers, each making a strategic choice either to keep the output at 5 units or at 10 units.
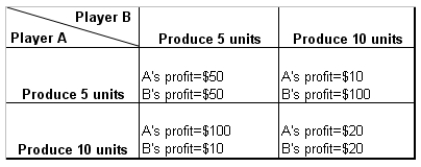 -Refer to Table 7-1.Which of the following output combinations represents the dominant strategy of the two players?
(Multiple Choice)
4.8/5 (35)
In an oligopoly market with a dominant firm and a competitive fringe, if market demand is _____, the market price will be low and the _____ profit will be small.
(Multiple Choice)
4.9/5 (43)
How is the dominant firm's residual demand curve derived in an oligopoly market?
(Essay)
4.9/5 (31)
In an ascending value auction, a bidder attempts to win a certain object by bidding a price below his valuation but higher than anyone else's bid.
(True/False)
4.8/5 (42)
The figure given below represents the total output and price produced in an oligopoly market characterized by a dominant firm and a fringe.SF represents the supply curve of the fringe, D is the market demand curve, DRES represents the residual demand curve of the dominant firm, MRRES represents the residual marginal revenue curve of the dominant firm, and MCD represents the marginal cost of the dominant firm.
-Refer to Figure .If the dominant firm decides to maximize the present value of his future profits and threatens a price war:
(Multiple Choice)
4.8/5 (33)
When can a grim trigger prevent oligopolists from breaking an agreement?
(Essay)
4.8/5 (26)
The figure given below represents the output choices of each of the two oligopolists, given the choices of its competitor.QA and QB are the quantities of output produced by Producer A and Producer B.The marginal cost of production is zero for both producers.
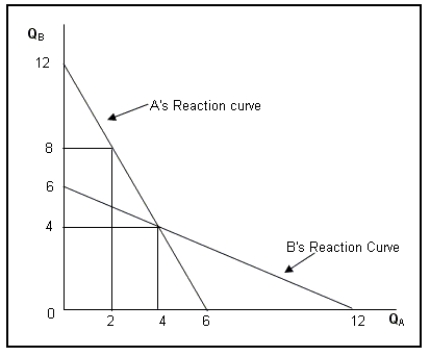 -Refer to.If Producer A and Producer B act as a price-takers what will be the total output produced in the market?
(Multiple Choice)
4.9/5 (42)
Filters
- Essay(0)
- Multiple Choice(0)
- Short Answer(0)
- True False(0)
- Matching(0)