Exam 3: Applying Advanced Formatting to Objects
Exam 1: Creating a Presentation100 Questions
Exam 2: Adding Media and Special Effects100 Questions
Exam 3: Applying Advanced Formatting to Objects99 Questions
Exam 4: Advanced Animations and Distributing Presentations99 Questions
Exam 5: Integrating Powerpoint With Other Programs100 Questions
Exam 6: Customizing Presentations and the Powerpoint Environment100 Questions
Exam 7: Managing Your Files100 Questions
Exam 8: Presentation Concepts: Planning, Developing, and Giving a Presentation99 Questions
Select questions type
MATCHING
-Combines selected shapes and removes the sections of the shapes that overlap
(Multiple Choice)
4.8/5  (37)
(37)
In a graph, you would find the _____ variable on the vertical axis.
(Multiple Choice)
4.8/5 (32)
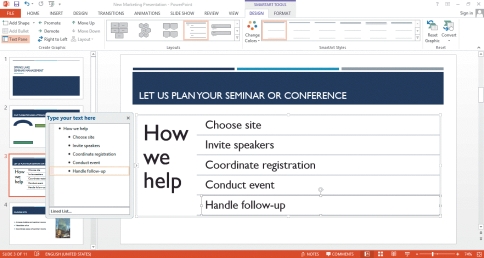
To switch the order of the shapes in SmartArt, click the _____ button in the Create Graphic group on the SMARTART TOOLS DESIGN tab.
(Multiple Choice)
4.9/5 (28)
To save a custom shape as a picture file so that you can use it in other files, right-click it, and then click _____ on the shortcut menu.
(Multiple Choice)
4.8/5 (46)
Colored borders and shading of cells indicate that they are included in the chart.
(True/False)
4.9/5 (28)
If the background of a photo is all one color, you can use the _____ Transparent Color button, and choose a color.
(Multiple Choice)
4.7/5 (38)
The _____ Merge Shape command separates overlapping portions of shapes into separate shapes.
(Multiple Choice)
4.9/5 (32)
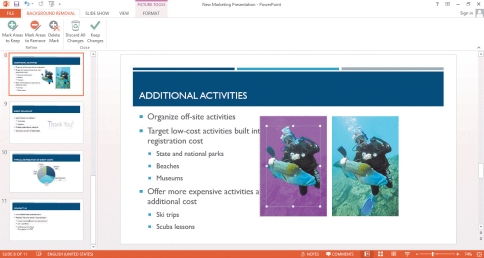 -Referring to the accompanying illustration, when you are done removing the background, on the BACKGROUND REMOVAL tab, in the _____ group, click the Keep Changes button.
(Multiple Choice)
4.9/5 (27)
_____ charts use a line to connect points that represent values, and also show shading from the line down to the x-axis.
(Multiple Choice)
4.8/5 (30)
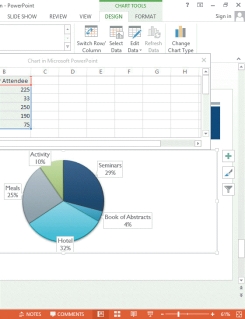 -Referring to the accompanying illustration, when a chart is selected the _____ contextual tabs appear on the ribbon.
(Multiple Choice)
4.9/5 (36)
If you need to modify a chart's data, click the Edit Data button in the Data group on the CHART TOOLS ____________________ tab.
(Short Answer)
4.7/5 (34)
You can fill a shape with a _____, which is a pattern that gives a tactile quality to the shape, such as crumpled paper or marble.
(Multiple Choice)
4.8/5 (34)
 -To create a chart, you click the Insert Chart button in a content placeholder or use the Chart button in the Illustrations group on the _____ tab.
(Multiple Choice)
4.8/5 (31)
When working with a chart, if you need additional tools, click the _____ in Microsoft Excel button to open the spreadsheet in an Excel workbook.
(Multiple Choice)
4.8/5 (34)
To add a sound clip to a slide, you use the Audio button in the Media group on the DESIGN tab. _________________________
(True/False)
4.8/5 (29)
Graphs show the relationship between variables along two axes or reference lines. _________________________
(True/False)
4.8/5 (25)
-Referring to the accompanying illustration, to remove the background from the photo, the first step is to choose the _____ tab on the ribbon.
(Multiple Choice)
4.7/5 (37)
Filters
- Essay(0)
- Multiple Choice(0)
- Short Answer(0)
- True False(0)
- Matching(0)