Exam 3: Applying Advanced Formatting to Objects
Exam 1: Creating a Presentation100 Questions
Exam 2: Adding Media and Special Effects100 Questions
Exam 3: Applying Advanced Formatting to Objects99 Questions
Exam 4: Advanced Animations and Distributing Presentations99 Questions
Exam 5: Integrating Powerpoint With Other Programs100 Questions
Exam 6: Customizing Presentations and the Powerpoint Environment100 Questions
Exam 7: Managing Your Files100 Questions
Exam 8: Presentation Concepts: Planning, Developing, and Giving a Presentation99 Questions
Select questions type
____________________ text is text added to an object that describes the object.
(Short Answer)
4.9/5  (28)
(28)
To correct photos, the Picture button must be selected on the Format Picture task pane.
(True/False)
4.8/5 (33)
MATCHING
-Combines selected shapes without removing any portions
(Multiple Choice)
4.8/5 (36)
When you click the _____ Background button in the Adjust group on the PICTURE TOOLS FORMAT tab, part of the photograph is marked to be removed and part of it is marked to be retained.
(Multiple Choice)
4.7/5 (37)
To insert a text box, Jim clicks the _____ tab on the ribbon.
(Multiple Choice)
4.8/5 (36)
Color saturation is the amount or intensity of color in a photo. _________________________
(True/False)
4.8/5 (33)
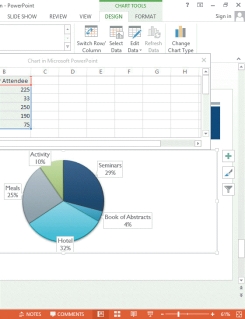 -Referring to the accompanying illustration, to modify a chart's data, click the _____ button in the Data group on the CHART TOOLS DESIGN tab.
(Multiple Choice)
4.8/5 (25)
Most screen readers cannot read the text in title text boxes and bulleted lists, so you usually need to add alt text for those objects.
(True/False)
4.9/5 (38)
If you make changes to photos and then change your mind, you can click the Reset Picture button in the _____ group on the PICTURE TOOLS FORMAT tab.
(Multiple Choice)
4.8/5 (29)
MATCHING
-Combines selected shapes and removes everything except the sections that overlap
(Multiple Choice)
4.9/5 (48)
A data diagram is the set of values represented in a chart. _________________________
(True/False)
4.9/5 (32)
Please describe the following types of charts and when they should be used: column, bar, line, area, and pie.
(Essay)
4.9/5 (22)
MATCHING
-To correct pictures the ____ button must be selected
(Multiple Choice)
4.9/5 (36)
WordArt text has a fill color, which is the same as the _____ color.
(Multiple Choice)
5.0/5 (32)
The ____________________ of a photo is the amount of reds and yellows or blues and greens in the photo.
(Short Answer)
4.8/5 (34)
MATCHING
-Amount of reds and yellows or blues and greens in a photo
(Multiple Choice)
4.9/5 (40)
In a pie chart each slice represents a(n) ____________________ of data.
(Short Answer)
4.8/5 (34)
-Referring to the accompanying illustration, click the _____ buttons to the right of the chart to display menus of chart-related commands.
(Multiple Choice)
4.7/5 (28)
Jim wants to insert text that appears without a fill color and where the text is left-aligned. Jim should insert a _____.
(Multiple Choice)
4.8/5 (39)
When a chart is selected, the ____________________ contextual tabs appear on the ribbon.
(Short Answer)
4.8/5 (37)
Filters
- Essay(0)
- Multiple Choice(0)
- Short Answer(0)
- True False(0)
- Matching(0)