Exam 21: The Influence of Monetary and Fiscal Policy on Aggregate Demand
Exam 1: Ten Principles of Economics347 Questions
Exam 2: Thinking Like an Economist535 Questions
Exam 3: Interdependence and the Gains From Trade442 Questions
Exam 4: The Market Forces of Supply and Demand569 Questions
Exam 5: Elasticity and Its Application503 Questions
Exam 6: Supply, Demand, and Government Policies556 Questions
Exam 7: Consumers, Producers, and the Efficiency of Markets460 Questions
Exam 8: Application: The Costs of Taxation422 Questions
Exam 9: Application: International Trade409 Questions
Exam 10: Measuring a Nations Income428 Questions
Exam 11: Measuring the Cost of Living436 Questions
Exam 12: Production and Growth417 Questions
Exam 13: Saving, Investment, and the Financial System473 Questions
Exam 14: The Basic Tools of Finance419 Questions
Exam 15: Unemployment571 Questions
Exam 16: The Monetary System423 Questions
Exam 17: Money Growth and Inflation388 Questions
Exam 18: Open-Economy Macroeconomic Models448 Questions
Exam 19: A Macroeconomic Theory of the Open Economy374 Questions
Exam 20: Aggregate Demand and Aggregate Supply471 Questions
Exam 21: The Influence of Monetary and Fiscal Policy on Aggregate Demand416 Questions
Exam 22: The Short-Run Trade-Off Between Inflation and Unemployment400 Questions
Exam 23: Six Debates Over Macroeconomic Policy235 Questions
Select questions type
In recent years, the Fed has chosen to target interest rates rather than the money supply because
(Multiple Choice)
4.9/5  (46)
(46)
On the graph that depicts the theory of liquidity preference,
(Multiple Choice)
4.7/5 (40)
In response to the sharp decline in stock prices in October 1987, the Federal Reserve
(Multiple Choice)
4.8/5 (28)
If the interest rate is above the Fed's target, the Fed should
(Multiple Choice)
4.8/5 (31)
Which particular interest rate(s) do we attempt to explain using the theory of liquidity preference?
(Multiple Choice)
4.7/5 (35)
A decrease in the interest rate could have been caused by the money-demand curve shifting
(Multiple Choice)
4.8/5 (36)
Figure 21-2. On the left-hand graph, MS represents the supply of money and MD represents the demand for money; on the right-hand graph, AD represents aggregate demand. The usual quantities are measured along the axes of both graphs.  -Refer to Figure 21-2. Assume the money market is always in equilibrium. Under the assumptions of the model,
(Multiple Choice)
4.8/5 (45)
Suppose aggregate demand shifts to the left and policymakers want to stabilize output. What can they do?
(Multiple Choice)
4.8/5 (35)
In which of the following cases would the quantity of money demanded be smallest?
(Multiple Choice)
4.9/5 (32)
Figure 21-3. 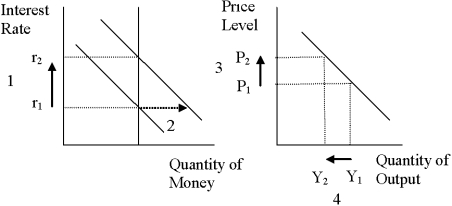 -Refer to Figure 21-3. What quantity is represented by the vertical line on the left-hand graph?
(Multiple Choice)
4.8/5 (39)
For the U.S. economy, which of the following is the most important reason for the downward slope of the aggregate-demand curve?
(Multiple Choice)
4.9/5 (40)
The multiplier effect is exemplified by the multiplied impact on
(Multiple Choice)
4.8/5 (37)
The interest rate would fall and the quantity of money demanded would
(Multiple Choice)
4.8/5 (41)
In the short run, an increase in the money supply causes interest rates to
(Multiple Choice)
4.8/5 (35)
Suppose that the Federal reserve is concerned about the effects of rising stock prices on the economy. What could it do?
(Multiple Choice)
4.9/5 (32)
Which of the following events shifts aggregate demand rightward?
(Multiple Choice)
4.7/5 (40)
Filters
- Essay(0)
- Multiple Choice(0)
- Short Answer(0)
- True False(0)
- Matching(0)