Exam 21: The Influence of Monetary and Fiscal Policy on Aggregate Demand
Exam 1: Ten Principles of Economics347 Questions
Exam 2: Thinking Like an Economist535 Questions
Exam 3: Interdependence and the Gains From Trade442 Questions
Exam 4: The Market Forces of Supply and Demand569 Questions
Exam 5: Elasticity and Its Application503 Questions
Exam 6: Supply, Demand, and Government Policies556 Questions
Exam 7: Consumers, Producers, and the Efficiency of Markets460 Questions
Exam 8: Application: The Costs of Taxation422 Questions
Exam 9: Application: International Trade409 Questions
Exam 10: Measuring a Nations Income428 Questions
Exam 11: Measuring the Cost of Living436 Questions
Exam 12: Production and Growth417 Questions
Exam 13: Saving, Investment, and the Financial System473 Questions
Exam 14: The Basic Tools of Finance419 Questions
Exam 15: Unemployment571 Questions
Exam 16: The Monetary System423 Questions
Exam 17: Money Growth and Inflation388 Questions
Exam 18: Open-Economy Macroeconomic Models448 Questions
Exam 19: A Macroeconomic Theory of the Open Economy374 Questions
Exam 20: Aggregate Demand and Aggregate Supply471 Questions
Exam 21: The Influence of Monetary and Fiscal Policy on Aggregate Demand416 Questions
Exam 22: The Short-Run Trade-Off Between Inflation and Unemployment400 Questions
Exam 23: Six Debates Over Macroeconomic Policy235 Questions
Select questions type
The multiplier for changes in government spending is calculated as
(Multiple Choice)
4.8/5  (36)
(36)
According to liquidity preference theory, if the quantity of money demanded is greater than the quantity supplied, then the interest rate will
(Multiple Choice)
4.7/5 (32)
Figure 21-2. On the left-hand graph, MS represents the supply of money and MD represents the demand for money; on the right-hand graph, AD represents aggregate demand. The usual quantities are measured along the axes of both graphs.  -Refer to Figure 21-2. What is measured along the horizontal axis of the left-hand graph?
(Multiple Choice)
4.9/5 (36)
If money demand shifted to the right and the Federal Reserve desired to return the interest rate to its original value, it could
(Multiple Choice)
4.8/5 (43)
Which of the following is not a reason the aggregate-demand curve slopes downward? As the price level increases,
(Multiple Choice)
4.9/5 (32)
Supply-side economists believe that changes in government purchases affect
(Multiple Choice)
4.8/5 (40)
The most important reason for the slope of the aggregate-demand curve is that as the price level
(Multiple Choice)
4.7/5 (38)
Which of the following would not be an expected response from a decrease in the price level and so help to explain the slope of the aggregate-demand curve?
(Multiple Choice)
4.8/5 (36)
Figure 21-2. On the left-hand graph, MS represents the supply of money and MD represents the demand for money; on the right-hand graph, AD represents aggregate demand. The usual quantities are measured along the axes of both graphs.
-Refer to Figure 21-2. A decrease in Y from Y1 to Y2 is explained as follows:
(Multiple Choice)
4.8/5 (34)
Figure 21-3. 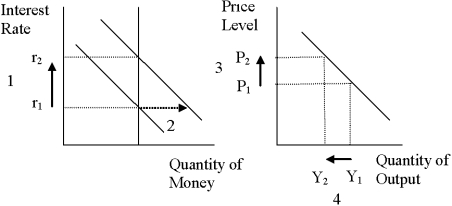 -Refer to Figure 21-3. For an economy such as the United States, what component of the demand for goods and services is most responsible for the decrease in output from Y1 to Y2?
(Multiple Choice)
4.8/5 (31)
Suppose there were a large decline in net exports. If the Fed wanted to stabilize output, it could
(Multiple Choice)
4.8/5 (33)
Filters
- Essay(0)
- Multiple Choice(0)
- Short Answer(0)
- True False(0)
- Matching(0)