Exam 21: The Influence of Monetary and Fiscal Policy on Aggregate Demand
Exam 1: Ten Principles of Economics347 Questions
Exam 2: Thinking Like an Economist535 Questions
Exam 3: Interdependence and the Gains From Trade442 Questions
Exam 4: The Market Forces of Supply and Demand569 Questions
Exam 5: Elasticity and Its Application503 Questions
Exam 6: Supply, Demand, and Government Policies556 Questions
Exam 7: Consumers, Producers, and the Efficiency of Markets460 Questions
Exam 8: Application: The Costs of Taxation422 Questions
Exam 9: Application: International Trade409 Questions
Exam 10: Measuring a Nations Income428 Questions
Exam 11: Measuring the Cost of Living436 Questions
Exam 12: Production and Growth417 Questions
Exam 13: Saving, Investment, and the Financial System473 Questions
Exam 14: The Basic Tools of Finance419 Questions
Exam 15: Unemployment571 Questions
Exam 16: The Monetary System423 Questions
Exam 17: Money Growth and Inflation388 Questions
Exam 18: Open-Economy Macroeconomic Models448 Questions
Exam 19: A Macroeconomic Theory of the Open Economy374 Questions
Exam 20: Aggregate Demand and Aggregate Supply471 Questions
Exam 21: The Influence of Monetary and Fiscal Policy on Aggregate Demand416 Questions
Exam 22: The Short-Run Trade-Off Between Inflation and Unemployment400 Questions
Exam 23: Six Debates Over Macroeconomic Policy235 Questions
Select questions type
One of President Obama's first policy initiatives was a stimulus bill that included large increases in government spending.
(True/False)
4.7/5  (35)
(35)
Which of the following policy alternatives would be an appropriate response to a sharp increase in investment spending, assuming policymakers want to stabilize output?
(Multiple Choice)
5.0/5 (48)
In a certain economy, when income is $200, consumer spending is $145. The value of the multiplier for this economy is 6.25. It follows that, when income is $230, consumer spending is
(Multiple Choice)
4.7/5 (34)
Figure 21-4. On the figure, MS represents money supply and MD represents money demand. 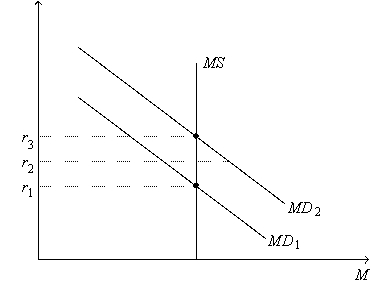 -Refer to Figure 21-4. Suppose the current equilibrium interest rate is r3. Which of the following events would cause the equilibrium interest rate to decrease?
(Multiple Choice)
4.8/5 (35)
The wealth effect stems from the idea that a higher price level
(Multiple Choice)
4.8/5 (35)
Figure 21-2. On the left-hand graph, MS represents the supply of money and MD represents the demand for money; on the right-hand graph, AD represents aggregate demand. The usual quantities are measured along the axes of both graphs.  -Refer to Figure 21-2. What does Y represent on the horizontal axis of the right-hand graph?
(Multiple Choice)
4.7/5 (32)
It is likely that a constitutional amendment that required the government always to run a balanced budget would
(Multiple Choice)
4.9/5 (39)
Figure 21-5. On the figure, MS represents money supply and MD represents money demand. 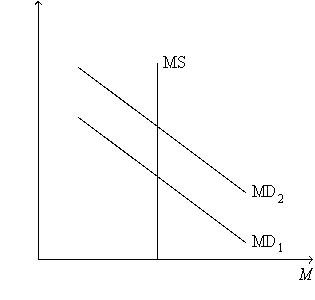 -Refer to Figure 21-5. A shift of the money-demand curve from MD1 to MD2 could be a result of
(Multiple Choice)
4.7/5 (34)
According to liquidity preference theory, investment spending would rise if the price level
(Multiple Choice)
4.8/5 (37)
Describe the process in the money market by which the interest rate reaches its equilibrium value if it starts above equilibrium.
(Essay)
4.8/5 (41)
Suppose that businesses and consumers become much more optimistic about the future of the economy. To stabilize output, the Federal Reserve could
(Multiple Choice)
4.8/5 (43)
An increase in government spending shifts aggregate demand
(Multiple Choice)
4.9/5 (38)
According to liquidity preference theory, a decrease in the price level shifts the
(Multiple Choice)
4.9/5 (31)
Filters
- Essay(0)
- Multiple Choice(0)
- Short Answer(0)
- True False(0)
- Matching(0)