Exam 12: Introduction to Simulation Using Risk Solver Platform
Exam 1: Introduction to Modeling and Decision Analysis51 Questions
Exam 2: Introduction to Optimization and Linear Programming62 Questions
Exam 3: Modeling and Solving Lp Problems in a Spreadsheet89 Questions
Exam 4: Sensitivity Analysis and the Simplex Method72 Questions
Exam 5: Network Modeling73 Questions
Exam 6: Integer Linear Programming73 Questions
Exam 7: Goal Programming and Multiple Objective Optimization62 Questions
Exam 8: Nonlinear Programming and Evolutionary Optimization69 Questions
Exam 9: Regression Analysis77 Questions
Exam 10: Discriminant Analysis60 Questions
Exam 11: Time Series Forecasting116 Questions
Exam 12: Introduction to Simulation Using Risk Solver Platform65 Questions
Exam 13: Queuing Theory80 Questions
Exam 14: Decision Analysis101 Questions
Exam 15: Project Management Online63 Questions
Select questions type
Best case analysis is a(n) ____ view of the problem.
Free
(Multiple Choice)
4.8/5  (46)
(46)
Correct Answer: Verified
B
The average demand is 4.45 cases per day. Using the information in Exhibit 12.3, what formula should go in cell H4 to determine the average lost sales?
Free
(Multiple Choice)
4.8/5 (38)
Correct Answer:Verified
D
The manager of a Washington, DC sightseeing tour company is concerned about overbooking for one of his bus tours. The bus has 15 seats but sometimes there are empty seats. His records show that about 20% of ticket holders do not show up for their tour. Tickets cost $10 and are non-refundable. If the manager overbooks the tour and more than 15 passengers show up, some of them will be bumped to a later tour. This bumping costs the company $25 in various expenses to keep the customer happy until the next tour. The manager wants to see what happens to profits if 18 reservations are accepted.  -Using the information in Exhibit 12.4, what formula should go in cell C13 of the worksheet to determine the Opportunity Cost of Empty Seats?
Free
(Multiple Choice)
4.8/5 (42)
Correct Answer:Verified
D
A simulation model was replicated 100 times yielding a mean of 82.59 with variance of 17.66. Of the 100 replications, 11 replications yielded an outcome over a value of 100. The 95% confidence interval of the mean is the interval (81.77, 83.41). Of the 100 simulation outcomes, 65 outcomes failed to fall within this interval. What is wrong with the confidence interval?
(Essay)
4.8/5 (41)
The owner of Fix-a-dent Auto Repair wants to study the growth of his business using simulation. He is interested in simulating the number of damaged cars and the amount of damage to the cars each month. He currently repairs 100 cars per month and feels this can vary uniformly between a decrease of as much as 3% and an increase of up to 5% (average change of 1%) over the previous months. The dollar value of the damage to the cars is a normally distributed random variable with a mean of $3,000 and a standard deviation of $500. The average repair bill has been increasing steadily over the years and the owner expects the mean repair bill will increase by 1% per month. You have created the following spreadsheet to simulate the problem.

 -Using the information in Exhibit 12.1, what Risk Solver Platform (RSP) function should go in cell B9 and copied to B10:B19 to compute the number of cars repaired in the subsequent months?
(Multiple Choice)
4.8/5 (25)
The Risk Solver Platform (RSP) is a good simulation tool because
(Multiple Choice)
4.8/5 (29)
What function should be used for generating random numbers from the following distribution on the number of phone calls per hour?

(Short Answer)
4.8/5 (30)
An auto parts store wants to simulate its inventory system for engine oil. The company has collected data on the shipping time for oil and the daily demand for cases of oil. A case of oil generates a $10 profit. Customers can buy oil at any auto parts store so there are no backorders (the company loses the sale and profit). The company orders 30 cases whenever the inventory position falls below the reorder point of 15 cases. Orders are placed at the beginning of the day and delivered at the beginning of the day so the oil is available on the arrival day. An average service level of 99% is desired. The following spreadsheets have been developed for this problem. The company has simulated 2 weeks of operation for their inventory system. The current level of on-hand inventory is 25 units and no orders are pending. 

 -Using the information in Exhibit 12.3, what Risk Solver Platform (RSP) function should be used in cell D8 and copied to cells D9:D21 of the MODEL sheet to compute daily demand?
(Multiple Choice)
5.0/5 (28)
A machine produces an average of 500 parts per day with a standard deviation of 10 parts. This is a normally distributed variable. The percent of defective parts ranges from 8-12%. Parts which need minor repair comprise 75% of the defective parts and cost $5 to repair. The rest of the defective parts cost $20 to repair. What formulas should go in cells B8:B15 to compute the daily cost of defective parts?

(Essay)
4.7/5 (40)
What is the probability that 3 or more phone calls are received in any hour of operation?

(Essay)
5.0/5 (41)
Which Risk Solver Platform (RSP) function will generate random numbers between 3 and 7 from a continuous uniform distribution?
(Multiple Choice)
5.0/5 (31)
A common application of Monte Carlo simulation is to provide numerical approximations. One such application is to approximate the area under a curve, or Monte Carlo integration. The following figure represents such a curve, defined over the range of X = 0 to X = 13. Call the area under this curve a.Monte Carlo integration begins by overlaying on the curve of interest a region (call this region, B) whose area is easy to calculate (i.e., a box). Monte Carlo integration then involves the random generation of points in B and a determination of the percentage of these points that fall in A (i.e., fall below the curve). This percentage represents that portion of the area of B that is the area of a.Use Monte Carlo integration techniques to approximate the area under the curve. Use exact techniques to calculate the true area under the curve. How accurate is your approximation? 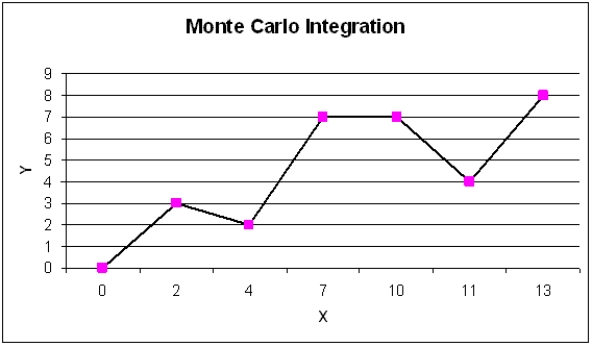
(Essay)
4.9/5 (32)
A simulation model was replicated 100 times yielding a mean of 82.59 with variance of 17.66. Of the 100 replications, 11 replications yielded an outcome over a value of 100. What is the 90% confidence interval on the mean?
(Essay)
5.0/5 (37)
The owner of Fix-a-dent Auto Repair wants to study the growth of his business using simulation. He is interested in simulating the number of damaged cars and the amount of damage to the cars each month. He currently repairs 100 cars per month and feels the change in number of cars can vary uniformly between a decrease of as much as 3% and an increase of up to 5% (average change of 1%). The dollar value of the damage to the cars is a normally distributed random variable with a mean of $3,000 and a standard deviation of $500. The average repair bill has been increasing steadily over the years and the owner expects the mean repair bill will increase by 1% per month. A spreadsheet model to simulate the problem has been run 300 times. A part of the simulation statistics output from Risk Solver Platform (RSP)and a spreadsheet for computing confidence intervals follows.

 -Using the information in Exhibit 12.2, what is the worst case scenario for the Fix-a-dent company based on this output?
(Multiple Choice)
4.9/5 (40)
What function should be used for generating random numbers from a normal distribution with mean and standard deviation ?
(Essay)
4.9/5 (33)
Which Risk Solver Platform (RSP) function will generate random integer numbers between 2 and 8?
(Multiple Choice)
5.0/5 (34)
Filters
- Essay(0)
- Multiple Choice(0)
- Short Answer(0)
- True False(0)
- Matching(0)