Exam 12: Analysis & Interpretation: Individual Variables Independently
Exam 1: Marketing Research: From Data to Information to Action29 Questions
Exam 2: The Research Question: Formulation of the Problem25 Questions
Exam 3: Exploratory, Descriptive, and Causal Research Designs84 Questions
Exam 4: Collecting Secondary Data from Inside and Outside the Organization43 Questions
Exam 5: Collecting Primary Data by Observation62 Questions
Exam 6: Collecting Primary Data by Communication40 Questions
Exam 7: Asking Good Questions75 Questions
Exam 8: Designing the Questionnaire79 Questions
Exam 9: Developing the Sampling Plan85 Questions
Exam 10: Data Collection: Enhancing Response Rates while Limiting Errors76 Questions
Exam 11: Data Preparation for Analysis35 Questions
Exam 12: Analysis & Interpretation: Individual Variables Independently61 Questions
Exam 13: Analysis & Interpretation: Multiple Variables Simultaneously64 Questions
Exam 14: The Research Report52 Questions
Select questions type
Which of the following statements concerning the sample standard deviation is FALSE?
(Multiple Choice)
4.9/5  (35)
(35)
An observation so different in magnitude from the rest of the observations that the analyst chooses to treat it as a special case is called a(n) ____________________.
(Short Answer)
4.8/5 (36)
A clothing manufacturer traditionally makes sweatshirts from three different fabrics, A, B and C. Over the years the percentages sold of each fabric are 50, 35, and 15, respectively. Recently, the manufacturer began producing running suits from the same three fabrics. During the first three months of production, the company received orders for 6,500 suits made from fabric A, 3,400 from fabric B, and 2,700 from fabric C.
-Refer to Exhibit 12.4. What is the value of the test statistic useful for determining how well the pattern of sales (by fabric type) of the new running suit corresponds to the expected pattern?
(Multiple Choice)
4.8/5 (35)
A researcher is interested in analyzing a set of nominal data to determine if the observed pattern of frequencies corresponds to the expected pattern. The appropriate statistical technique is:
(Multiple Choice)
4.7/5 (35)
A statistical test to determine whether some observed pattern of frequencies corresponds to an expected pattern is called a chi-square goodness-of-fit test.
(True/False)
4.7/5 (35)
You can "prove" that the alternative hypothesis is true if the null hypothesis is rejected.
(True/False)
4.8/5 (32)
Use the information below to answer the questions.
A major car manufacturer was interested in whether its midsize car was selling consistently in two markets with respect to the annual income of the car purchasers. 500 new car buyers in Chicago and Miami were surveyed. In Chicago the following pattern was observed:
 Among those surveyed in Miami, 20 earned under $20,000; 70 earned between $20,000 and $30,000; 265 earned between $30,000 and $40,000; 125 earned between $40,000 and $50,000; and 20 earned more than $50,000.
-Refer to Exhibit 12.3. The chi-square test was used to check whether Miami sales among income groups were consistent with Chicago's. The appropriate degrees of freedom for the chi-square test would be:
Among those surveyed in Miami, 20 earned under $20,000; 70 earned between $20,000 and $30,000; 265 earned between $30,000 and $40,000; 125 earned between $40,000 and $50,000; and 20 earned more than $50,000.
-Refer to Exhibit 12.3. The chi-square test was used to check whether Miami sales among income groups were consistent with Chicago's. The appropriate degrees of freedom for the chi-square test would be:
(Multiple Choice)
4.7/5 (40)
A researcher had calculated the sample chi-square test statistic to be equal to x2= 7.71. For an alpha level of 0.10 and 4 degrees of freedom, the critical value of the chi-square statistic is 7.78. The appropriate conclusion is that the
(Multiple Choice)
4.9/5 (37)
In estimating the standard deviation in the population for the formula for calculating the sample size for estimating a mean, we can use some prior knowledge about the:
(Multiple Choice)
4.8/5 (31)
The ____________________ is a statistical test to determine whether some observed pattern of frequencies corresponds to and expected pattern.
(Short Answer)
4.9/5 (26)
To calculate sampling error for a proportion, which of the following pieces of information is NOT needed?
(Multiple Choice)
4.9/5 (28)
Which of the following is FALSE about the use of percentages when reporting results?
(Multiple Choice)
4.8/5 (34)
Suppose that a random sample of 550 new car owners found that 38 percent of them were aware of a particular brand of tires that your company sells. If you are willing to accept less than a 5 percent chance of error that the true awareness rate of your company's brand of tire across all new car owners is less than 0.45, which statistical technique should you use from this data?
(Multiple Choice)
4.8/5 (35)
The logic of hypothesis testing is that if we assume that the hypothesized value is the population parameter, then, at the 95% level of confidence, if we took 100 separate samples, the z-value for 95 of those samples would fall between + or - 1.96.
(True/False)
4.8/5 (29)
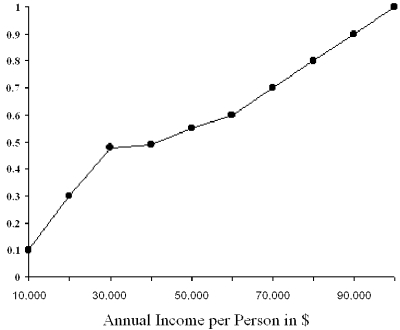 -Refer to Exhibit 12.1. The median income in the above figure is
(Multiple Choice)
5.0/5 (41)
Which types of measurement are used to group respondents or objects into groups or categories and are thus referred to as categorical measures?
(Multiple Choice)
4.8/5 (35)
The hypothesis that a proposed result is not true for the population is called the ____________________ hypothesis.
(Short Answer)
4.7/5 (42)
-Refer to Exhibit 12.1. $50,000 represents the ____ in the figure above.
(Multiple Choice)
4.8/5 (40)
Which of the following would NOT be an example of a situation involving univariate analysis?
(Multiple Choice)
4.8/5 (37)
Filters
- Essay(0)
- Multiple Choice(0)
- Short Answer(0)
- True False(0)
- Matching(0)