Exam 1: Introduction to Physiology
Exam 1: Introduction to Physiology63 Questions
Exam 2: Molecular Interactions149 Questions
Exam 3: Compartmentation: Cells and Tissues159 Questions
Exam 4: Energy and Cellular Metabolism144 Questions
Exam 5: Membrane Dynamics136 Questions
Exam 6: Communication, Integration, and Homeostasis79 Questions
Exam 7: Introduction to the Endocrine System76 Questions
Exam 8: Neurons: Cellular and Network Properties223 Questions
Exam 9: The Central Nervous System107 Questions
Exam 10: Sensory Physiology173 Questions
Exam 11: Efferent Division: Autonomic and Somatic Motor Control75 Questions
Exam 12: Muscles100 Questions
Exam 13: Integrative Physiology I: Control of Body Movement69 Questions
Exam 14: Cardiovascular Physiology184 Questions
Exam 15: Blood Flow and the Control of Blood Pressure121 Questions
Exam 16: Blood107 Questions
Exam 17: Mechanics of Breathing117 Questions
Exam 18: Gas Exchange and Transport84 Questions
Exam 19: The Kidneys75 Questions
Exam 20: Integrative Physiology II: Fluid and Electrolyte Balance80 Questions
Exam 21: The Digestive System131 Questions
Exam 22: Metabolism and Energy Balance132 Questions
Exam 23: Endocrine Control of Growth and Metabolism97 Questions
Exam 24: The Immune System116 Questions
Exam 25: Integrative Physiology III: Exercise62 Questions
Exam 26: Reproduction and Development122 Questions
Select questions type
A physician basing clinical decisions on primary research published in biomedical literature is doing ________ medicine.
(Multiple Choice)
4.8/5  (28)
(28)
Explain why animals are used in research.Are there any limitations to the application of animal data to human physiology? Could these limitations be addressed using cell or tissue culture,or computer simulations?
(Essay)
4.8/5 (29)
What is the difference between a peer-reviewed article and a review article?
(Essay)
4.8/5 (42)
Table
1.3 shows data on various factors that may or may not be related to resting pulse rate,time to recovery to resting pulse rate after a few minutes of exercise,and reaction time measured by how quickly a student could press a keyboard key after seeing a computer-generated prompt.For each question below,write a testable hypothesis,identify the dependent and independent variables,sketch an appropriate graph of the results,and draw a conclusion from the data presented in the table.Discuss your results.
A.Does caffeine consumption have an effect on resting pulse rate?
B.Does age play a role in resting pulse rate? Does weight?
C.Is there a relationship between eating breakfast and recovery time?
D.Is there a relationship between reaction time and height?
E.Do women who smoke show differences in their resting pulse rates compared to female nonsmokers or to male smokers and nonsmokers?
F.Does regular exercise have an effect on resting pulse rate?
(Essay)
4.8/5 (35)
Use the table and graph below to answer the following questions. 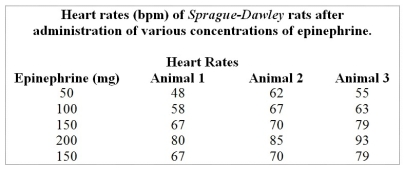 Table 1.1
 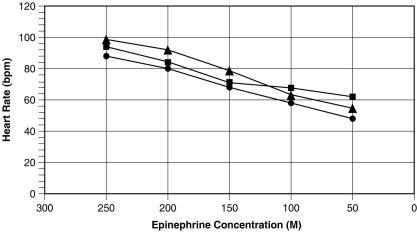 Figure 1.1
-Use Table 1.1 to graph the data appropriately.What can you CONCLUDE based on the new figure?
Figure 1.1
-Use Table 1.1 to graph the data appropriately.What can you CONCLUDE based on the new figure?
(Essay)
4.8/5 (46)
A technique used to resolve contradictory results in scientific studies is
(Multiple Choice)
4.7/5 (32)
The following is a list of several levels of organization that make up the human body.
1)tissue
2)cell
3)organ
4)molecule
5)organism
6)organ system
The correct order from the smallest to the largest is
(Multiple Choice)
4.9/5 (36)
You conduct an experiment on twenty 18-year-old male subjects to see how various intensities of exercise influence heart rate.Which of the following is/are considered an independent variable?
(Multiple Choice)
4.7/5 (35)
Use the table and graph below to answer the following questions. Table 1.1 Figure 1.1
-How can you determine the control value using Figure 1.1?
(Essay)
4.8/5 (41)
What is a hypothesis? What are the steps involved in following the scientific method? How does one distinguish the dependent variable from the independent variable in an experiment? How are each of these represented on a graph?
(Not Answered)
This question doesn't have any answer yet
Use the table and graph below to answer the following questions. Table 1.1 Figure 1.1
-List all of the errors in Figure 1.1.
(Essay)
4.9/5 (31)
You are interested in learning more about Parkinson's disease,a neurological disorder that primarily affects motor function.What is the best source to begin your investigation?
(Multiple Choice)
4.9/5 (37)
Following is a table of data collected from one section of an 8 a.m.physiology lab.There were 20 students present,10 men and 10 women.Information collected from the students included their height,weight,age,and resting pulse rate.In addition,the students were surveyed to see if they smoked cigarettes,considered themselves "regular exercisers," if they had consumed caffeine the morning of the lab,and if they had eaten breakfast that day.A "y" or "n" (yes or no)was recorded to indicate their answers.Each student did "jumping jacks" for 5 minutes and recorded the time required to regain their resting heart rate,which is listed on the table as "recovery time." Finally,each student participated in an exercise designed to measure their reaction time (in milliseconds)in catching an object dropped by a lab partner according to specified criteria.Use this table to answer the following questions.Ignore statistical problems caused by small sample size,and so on. 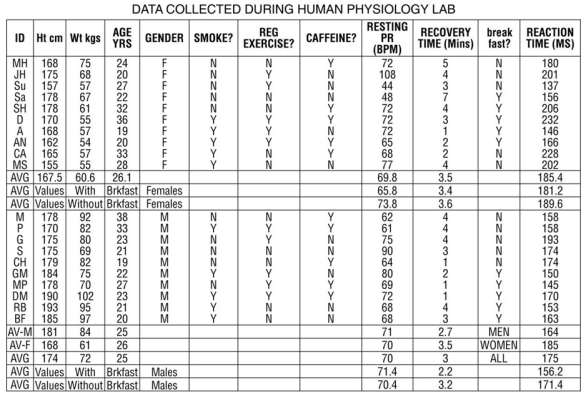 Table 1.3
 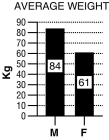 For these questions,the data were separated and analyzed by gender.
-Refer to Table 1.3 and the bar graph.
A.Write a hypothesis regarding gender and weight.
B.What is the dependent variable? What is the independent variable?
C.Based on the data in the graph above,what is your conclusion?
D.Why is a bar graph a good choice for presentation of these data? Would another type of chart be as effective?
For these questions,the data were separated and analyzed by gender.
-Refer to Table 1.3 and the bar graph.
A.Write a hypothesis regarding gender and weight.
B.What is the dependent variable? What is the independent variable?
C.Based on the data in the graph above,what is your conclusion?
D.Why is a bar graph a good choice for presentation of these data? Would another type of chart be as effective?
(Essay)
4.9/5 (37)
Seasonal Affective Depressive Disorder or SADD is a condition commonly seen in Northern climates of the United States and Canada and it may be due to a decrease in the amount of sunlight they receive during winter months.How is this condition related to biological rhythms and what process is not being compensated for well enough?
(Essay)
4.8/5 (39)
"Glucose is transported from blood into cells by transporters in response to insulin." This type of explanation is
(Multiple Choice)
4.9/5 (33)
Which of the following is one of Cannon's "internal secretions"?
(Multiple Choice)
4.8/5 (31)
Filters
- Essay(0)
- Multiple Choice(0)
- Short Answer(0)
- True False(0)
- Matching(0)