Exam 1: Introduction to Physiology
Exam 1: Introduction to Physiology63 Questions
Exam 2: Molecular Interactions149 Questions
Exam 3: Compartmentation: Cells and Tissues159 Questions
Exam 4: Energy and Cellular Metabolism144 Questions
Exam 5: Membrane Dynamics136 Questions
Exam 6: Communication, Integration, and Homeostasis79 Questions
Exam 7: Introduction to the Endocrine System76 Questions
Exam 8: Neurons: Cellular and Network Properties223 Questions
Exam 9: The Central Nervous System107 Questions
Exam 10: Sensory Physiology173 Questions
Exam 11: Efferent Division: Autonomic and Somatic Motor Control75 Questions
Exam 12: Muscles100 Questions
Exam 13: Integrative Physiology I: Control of Body Movement69 Questions
Exam 14: Cardiovascular Physiology184 Questions
Exam 15: Blood Flow and the Control of Blood Pressure121 Questions
Exam 16: Blood107 Questions
Exam 17: Mechanics of Breathing117 Questions
Exam 18: Gas Exchange and Transport84 Questions
Exam 19: The Kidneys75 Questions
Exam 20: Integrative Physiology II: Fluid and Electrolyte Balance80 Questions
Exam 21: The Digestive System131 Questions
Exam 22: Metabolism and Energy Balance132 Questions
Exam 23: Endocrine Control of Growth and Metabolism97 Questions
Exam 24: The Immune System116 Questions
Exam 25: Integrative Physiology III: Exercise62 Questions
Exam 26: Reproduction and Development122 Questions
Select questions type
Following is a table of data collected from one section of an 8 a.m.physiology lab.There were 20 students present,10 men and 10 women.Information collected from the students included their height,weight,age,and resting pulse rate.In addition,the students were surveyed to see if they smoked cigarettes,considered themselves "regular exercisers," if they had consumed caffeine the morning of the lab,and if they had eaten breakfast that day.A "y" or "n" (yes or no)was recorded to indicate their answers.Each student did "jumping jacks" for 5 minutes and recorded the time required to regain their resting heart rate,which is listed on the table as "recovery time." Finally,each student participated in an exercise designed to measure their reaction time (in milliseconds)in catching an object dropped by a lab partner according to specified criteria.Use this table to answer the following questions.Ignore statistical problems caused by small sample size,and so on. 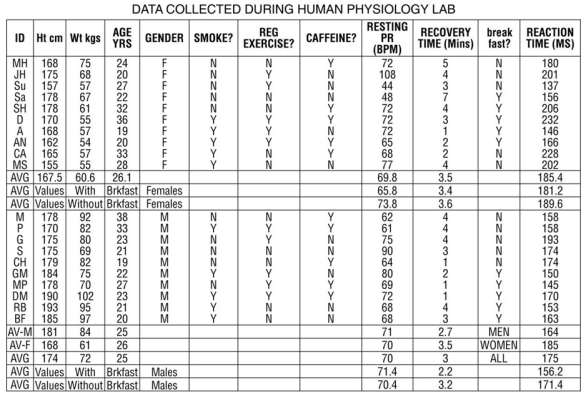 Table 1.3
 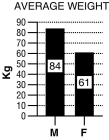 For these questions,the data were separated and analyzed by gender.
-Refer to Table 1.3 and the bar graph.
A.Disregarding gender,write a hypothesis that expresses the relationship between weight and height.
B.What is the dependent variable? What is the independent variable?
C.From the data in Table
1.3,construct a graph that examines this relationship.
For these questions,the data were separated and analyzed by gender.
-Refer to Table 1.3 and the bar graph.
A.Disregarding gender,write a hypothesis that expresses the relationship between weight and height.
B.What is the dependent variable? What is the independent variable?
C.From the data in Table
1.3,construct a graph that examines this relationship.
(Essay)
4.9/5  (37)
(37)
Provide an example of a control system.Be sure to include the three main components: an input signal,a controller,and an output signal.
(Essay)
4.9/5 (36)
Place these terms in the typical sequence in which they appear in the scientific process: experimental data,theory,model,observation,hypothesis,replication.
(Multiple Choice)
4.9/5 (41)
You are doing an experiment to determine if caffeine consumption affects reaction time.
A.Which is the dependent variable?
B.Which is the independent variable?
C.Briefly describe some ways you might manipulate the independent variable.
D.Name three stimuli you could use,and how you might measure reaction time for each.
E.Write an appropriate hypothesis for this study.
F.You compute the following average values from your experiment.What would be a logical conclusion for these data?
Average caffeine consumer's reaction time: 400 ms
Average noncaffeine consumer's reaction time: 650 ms
G.Sketch a simple graph to convey these results to your classmates.What kind of graph did you choose? Why? Which variable did you plot on the x-axis? Which one did you plot on the y-axis? Why?
H.Do the results of this experiment support the hypothesis you chose?
(Essay)
4.9/5 (38)
Oxytocin is a hormone that is released in response to cervical dilation.It in turn causes more uterine contractions that will further dilate the cervix.What type of feedback loop does oxytocin trigger?
(Multiple Choice)
4.9/5 (34)
Following is a table of data collected from one section of an 8 a.m.physiology lab.There were 20 students present,10 men and 10 women.Information collected from the students included their height,weight,age,and resting pulse rate.In addition,the students were surveyed to see if they smoked cigarettes,considered themselves "regular exercisers," if they had consumed caffeine the morning of the lab,and if they had eaten breakfast that day.A "y" or "n" (yes or no)was recorded to indicate their answers.Each student did "jumping jacks" for 5 minutes and recorded the time required to regain their resting heart rate,which is listed on the table as "recovery time." Finally,each student participated in an exercise designed to measure their reaction time (in milliseconds)in catching an object dropped by a lab partner according to specified criteria.Use this table to answer the following questions.Ignore statistical problems caused by small sample size,and so on. Table 1.3 For these questions,the data were separated and analyzed by gender.
-Refer to Table 1.3 and the bar graph.
A.Write a hypothesis regarding gender and recovery time.
B.What is the dependent variable? What is the independent variable?
C.Create a graph using the averages from the data table.Based on these data,what do you conclude?
(Essay)
4.9/5 (44)
The Internet database for molecular,cellular,and physiological information is called the ________ Project.
(Multiple Choice)
4.9/5 (33)
Because anatomy and physiology have different definitions,they are usually considered separately in studies of the body.
(True/False)
4.9/5 (34)
Why is it necessary to space grid marks on a graph proportionally to the quantity measured (example: each square represents one centimeter)?
(Essay)
4.8/5 (35)
Use the table and graph below to answer the following questions. 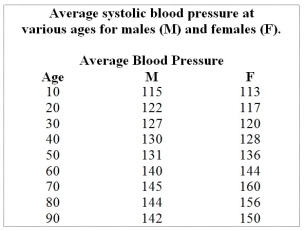 Table 1.2
 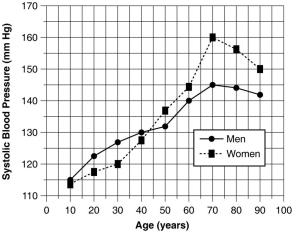 Figure 1.2
-Referring to Table
1.2,what general trend in systolic blood pressures is seen as both men and women increase in age?
Figure 1.2
-Referring to Table
1.2,what general trend in systolic blood pressures is seen as both men and women increase in age?
(Essay)
4.9/5 (39)
Match the level of organization with its definition below.
-tissue
(Multiple Choice)
4.7/5 (37)
Match the level of organization with its definition below.
-organ systems
(Multiple Choice)
4.8/5 (39)
A horse runs 10 races,each a mile long,during a 6-month period,and you are interested in determining if the horse's race time changes with experience.You set up a graph to display the race finish times of this horse. What type of graph would be best to display the race finish times of this horse?
(Multiple Choice)
4.8/5 (38)
Explain why the prefix homeo- is used in the term homeostasis.Why do some physiologists prefer the term homeodynamics over homeostasis?
(Essay)
4.9/5 (36)
Adaptive significance is an important concept in physiology because it describes
(Multiple Choice)
4.8/5 (31)
Following is a table of data collected from one section of an 8 a.m.physiology lab.There were 20 students present,10 men and 10 women.Information collected from the students included their height,weight,age,and resting pulse rate.In addition,the students were surveyed to see if they smoked cigarettes,considered themselves "regular exercisers," if they had consumed caffeine the morning of the lab,and if they had eaten breakfast that day.A "y" or "n" (yes or no)was recorded to indicate their answers.Each student did "jumping jacks" for 5 minutes and recorded the time required to regain their resting heart rate,which is listed on the table as "recovery time." Finally,each student participated in an exercise designed to measure their reaction time (in milliseconds)in catching an object dropped by a lab partner according to specified criteria.Use this table to answer the following questions.Ignore statistical problems caused by small sample size,and so on. Table 1.3 For these questions,the data were separated and analyzed by gender.
-Refer to Table 1.3 and the bar graph.
A.Write a hypothesis regarding the effects of breakfast consumption on reaction time.
B.What is the dependent variable? What is the independent variable?
(Essay)
4.8/5 (32)
Which of the following is a buffer zone between the outside world and most of the cells of the body?
(Multiple Choice)
4.8/5 (34)
Match the level of organization with its definition below.
-cell
(Multiple Choice)
4.8/5 (42)
Filters
- Essay(0)
- Multiple Choice(0)
- Short Answer(0)
- True False(0)
- Matching(0)