Exam 1: Introduction to Physiology
Exam 1: Introduction to Physiology63 Questions
Exam 2: Molecular Interactions149 Questions
Exam 3: Compartmentation: Cells and Tissues159 Questions
Exam 4: Energy and Cellular Metabolism144 Questions
Exam 5: Membrane Dynamics136 Questions
Exam 6: Communication, Integration, and Homeostasis79 Questions
Exam 7: Introduction to the Endocrine System76 Questions
Exam 8: Neurons: Cellular and Network Properties223 Questions
Exam 9: The Central Nervous System107 Questions
Exam 10: Sensory Physiology173 Questions
Exam 11: Efferent Division: Autonomic and Somatic Motor Control75 Questions
Exam 12: Muscles100 Questions
Exam 13: Integrative Physiology I: Control of Body Movement69 Questions
Exam 14: Cardiovascular Physiology184 Questions
Exam 15: Blood Flow and the Control of Blood Pressure121 Questions
Exam 16: Blood107 Questions
Exam 17: Mechanics of Breathing117 Questions
Exam 18: Gas Exchange and Transport84 Questions
Exam 19: The Kidneys75 Questions
Exam 20: Integrative Physiology II: Fluid and Electrolyte Balance80 Questions
Exam 21: The Digestive System131 Questions
Exam 22: Metabolism and Energy Balance132 Questions
Exam 23: Endocrine Control of Growth and Metabolism97 Questions
Exam 24: The Immune System116 Questions
Exam 25: Integrative Physiology III: Exercise62 Questions
Exam 26: Reproduction and Development122 Questions
Select questions type
Use the table and graph below to answer the following questions. 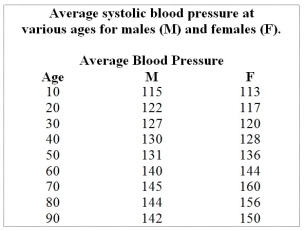 Table 1.2
 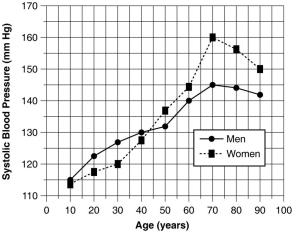 Figure 1.2
-Summarize the data shown in Figure 1.2.
Figure 1.2
-Summarize the data shown in Figure 1.2.
Free
(Essay)
4.8/5  (41)
(41)
Correct Answer: Verified
The systolic pressure of both genders increases with age.Under age 40,the systolic pressure of males is higher than that of females.After age 40,the systolic pressure of females is higher than that of males.The greatest rate of increase is from ages 50 to 70 in both genders.Blood pressure declines after age 70.
Match the level of organization with its definition below.
-organs
Free
(Multiple Choice)
4.7/5 (27)
Correct Answer:Verified
C
What would the labels be for the graph axes?
Free
(Essay)
4.8/5 (34)
Correct Answer:Verified
The x-axis is horse name or number; the y-axis is finish time in minutes.
Use the table and graph below to answer the following questions. Table 1.2 Figure 1.2
-Referring to Figure 1.2,at approximately what age do men begin to show higher systolic blood pressures than women? At what age does this trend reverse?
(Essay)
4.8/5 (27)
You are designing a study to assess the effects of a new treatment for hypertension.What ethical considerations would you employ when monitoring your progress?
(Essay)
5.0/5 (38)
You conduct an experiment on twenty 18-year-old male subjects to see how various intensities of exercise influence heart rate.Which of the following is/are considered a dependent variable?
(Multiple Choice)
4.8/5 (38)
Write a teleological explanation for why heart rate increases during exercise.Now write a mechanistic explanation for the same phenomenon.
(Essay)
4.9/5 (31)
How genetics influences the body's response to drugs is called
(Multiple Choice)
4.9/5 (31)
High cholesterol levels have been known to be a contributing factor to heart disease and death due to cardiovascular disease for many decades.In the 1970's,scientists used this information to develop a hypothesis that giving a medicine to reduce blood cholesterol levels could reduce the chances of developing cardiovascular disease or dying from cardiovascular disease.They tested a group of people living in a town called Framingham,Massachusetts.This study became known as the Framingham Study and it is very well known,because it did not support the hypothesis that giving cholesterol lowering medications would reduce the risk of developing or dying from cardiovascular disease.Does this mean that high cholesterol is not a risk factor for heart disease? What does this demonstrate about the scientific process,especially as it pertains to human studies? You can find a copy of the study online and read it,if necessary.
(Essay)
4.7/5 (25)
You want to display data on the finish times of the 10 fastest race horses in a single race at the Kentucky Derby. What type of graph would be best to display this information?
(Multiple Choice)
4.9/5 (40)
A study in which a participant acts as an experimental subject in part of the experiment and a control in another part of the experiment is called what?
(Multiple Choice)
4.9/5 (30)
In your study of a drug's efficacy in treating hypertension,your subjects are white males,ages 40 to 60 years.Is your study applicable to all people? Explain.
(Essay)
4.8/5 (35)
You conduct an experiment on twenty 18-year-old male subjects to see how various levels of exercise influence heart rate.Explain why only 18-year-old males were used as subjects.
(Essay)
4.8/5 (39)
There are 10 cloned horses,born on the same day,with identical chromosomes.They are each subjected to the same physical training regimen,but given daily injections of different concentrations of a particular vitamin.They all run the same race.You set up a graph to explore a relationship between race finish time and vitamin dose. Which type of graph is best to explore a relationship between race finish time and vitamin dose?
(Multiple Choice)
4.7/5 (35)
"Glucose is transported from blood into cells because cells require glucose to meet their energy needs." This type of explanation is
(Multiple Choice)
4.8/5 (34)
Filters
- Essay(0)
- Multiple Choice(0)
- Short Answer(0)
- True False(0)
- Matching(0)